Niterói, Brazil
Data-Driven Investment Benefits Youth and the City of Niterói
Project Type:
Youth Development, Community Engagement

At a Glance
In 2013, Niterói developed its first strategic plan, Niterói Que Queremos (The Niterói We Want), with online contributions from about 5,700 residents. The plan, with goals set until 2033, includes indicators that strengthen the city’s ability to monitor, evaluate, and improve public policies.
Niterói was among the first cities in Brazil to establish a Digital Government Strategy by decree in December 2022. Today, 100% of administrative processes are handled electronically.
Niterói is the first city in Brazil to conduct a large-scale municipal household sample survey. Beginning in 2025, the Niterói Que Somos (The Niterói We Are) survey will interview 15,000 households across all city regions and will be repeated every four years.
Niterói has won first place four times and received the highest score twice in Transparency Rankings from the Federal Public Prosecutor’s Office and the Office of the Comptroller General. The city’s Transparency Portal allows the public to track government spending and resource allocation.
Many things need to happen for a young person in a vulnerable situation to achieve the dream of attending college: years of study, support from family and teachers, and financial resources or scholarships. But for the youth of Niterói, data analysis is being used to implement public policies for social inclusion and shorten that path.
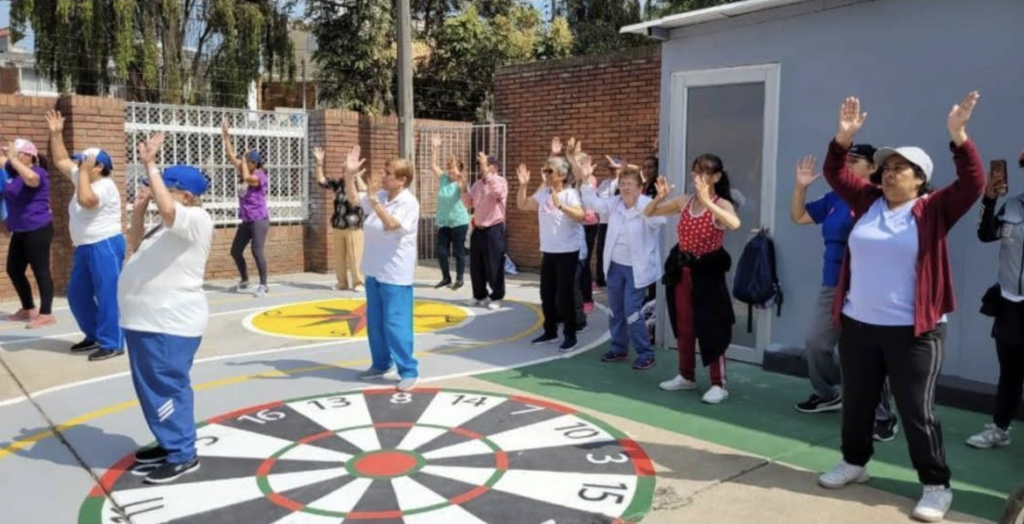
By analyzing information on public safety and education, the Niterói City Hall found that young people from more vulnerable neighborhoods needed more support to develop professional skills. Based on this data, the Niterói Jovem EcoSocial Program was developed to offer free professional training to young people aged 16 to 24 living in socially vulnerable areas. The program has a dual purpose: increasing youth employability and promoting the city’s environmental sustainability. The initiative is continuously monitored, closely tracking participants to assess its effectiveness and demonstrate the impact of education in reducing violence.

Walking through the communities impacted by EcoSocial shows that we have planted ideas of preservation and sustainability in the minds and hearts of young people in our city. More than that, we have contributed to their education and professional development, and we hope they will share their knowledge and do good in their communities.
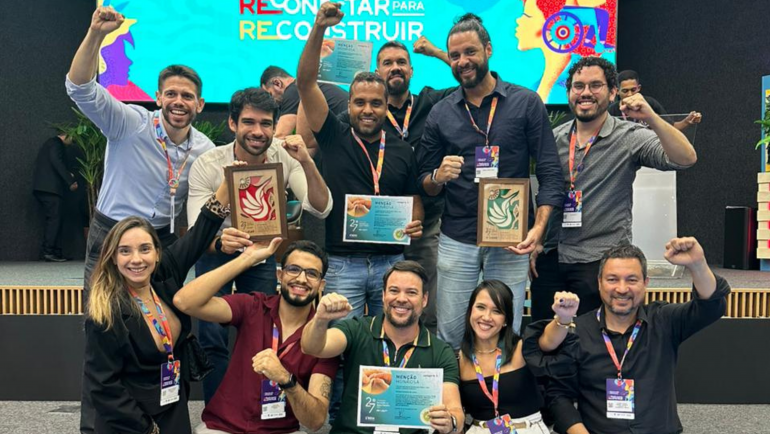
The Bloomberg Philanthropies What Works Cities Certification is, above all, an incentive—something that drives us to organize, modernize, and continually improve our strategies using technology and data analysis. We have earned certifications, recognition, and awards that show we are on the right path, investing in innovative initiatives like the Niterói Jovem EcoSocial Program. This is a concrete example of how well-structured policies, supported by technology and evidence, can transform lives.
900 young people from vulnerable neighborhoods have participated in the Jovem EcoSocial Program since 2019. Another 600 are currently enrolled in the third phase, expected to graduate in the first half of 2026.
Participants choose from a variety of classes and engage in field activities that develop their skills and contribute to their communities, such as assisting in reforestation and establishing community gardens. Since 2019, more than 900 young people have graduated from the program.
Jhonata Barcelos was part of the first EcoSocial cohort and received a job offer related to the courses he took in the program upon graduating in 2021. “A person is not born a professional,” he said. “They develop professionally. Who I am in my career today is 50% thanks to what EcoSocial provided me and 50% my own effort.”
The City continues to follow EcoSocial participants even after they complete the program, using outcome data to improve future editions, such as expanding the neighborhoods served and diversifying the courses offered. A strong culture of monitoring within the municipal government allows city management to evaluate what is working, what needs adjustment, and the progress made toward Niterói’s 20-year plan to become the best city to live in Brazil.
In 2023, Barcelos was accepted into the State University of Rio de Janeiro. He credits the EcoSocial program with opening the first door that allowed him to fulfill his dream of attending college. Through its commitment to data analysis, Niterói is creating more pathways to long-term success for Barcelos and hundreds of other young people.
More than 45,000 families receive the Arariboia Social Currency, an electronic currency that not only provides government benefits but also supports local businesses and encourages employment and school attendance.

In recent years, Niterói has made great strides in the strategic use of data for decision-making, policy formulation, and evaluation of public policies. Now, Niterói is innovating by launching Brazil’s first municipal household sample survey, Niterói que Somos. With it, we will have even greater capacity to improve our planning and develop more effective public policies based on detailed population data.