New York City, New York, USA

A Data-Driven Process to Reach Net Zero Emissions: Climate Budgeting

Project Type:
Health and Wellbeing, High-Performing Government, Youth Development

At a Glance


100% of City agencies have already submitted emissions impact data with all capital project budget requests


April 2024: When NYC will publish its first Climate Budget.


$4 billion: Amount the City will invest in a school electrification plan, which will contribute a 3% reduction in greenhouse gas emissions from government operations.

Climate Budgeting to Help Reach Zero Net Emissions

New York City has a goal to reach net-zero emissions citywide by 2050.

To reach that goal, city leaders must put data at the heart of day-to-day operations. One way the City is doing this is through a new municipal climate budget. As part of the climate budget, the City bolstered requirements for capital project budget requests to include projected emissions data, which are now being met by 100 percent of city agencies, contributing to a 27 percent reduction in greenhouse gas emissions from government operations.

“Climate budgeting is a significant shift in how we think about the value of tax dollars and their potential to power change. It’s the only way to use every budgeting decision to bring our climate ambitions to life. There’s no time to waste.”

Eric Adams, Mayor

Climate budgeting is a governance system that mainstreams climate targets and considerations into decision-making through the budget process and aligns the City’s resources with its climate goals. It is a paradigm shift from the traditional budget process to a holistic approach that considers the impact of every dollar the City spends on meeting its climate goals.

NYC’s climate budgeting is a core component of the City’s strategic climate plan announced in 2023 and is being led by New York City’s Office of Management and Budget, in partnership with the Mayor’s Office of Climate and Environmental Justice (MOCEJ).

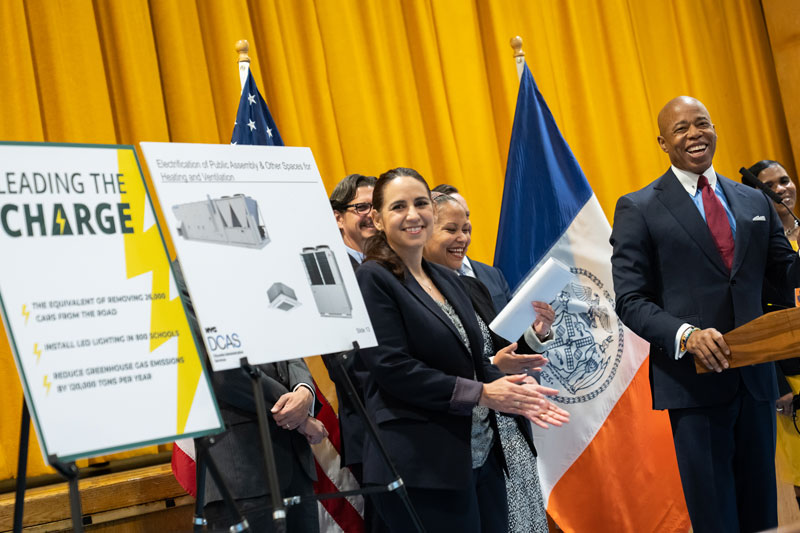
An early example of climate budgeting can be seen in the “Leading the Charge” initiative, a $4 billion plan now in motion, to ensure newly constructed schools will be all-electric and 100 existing schools will begin to phase out fossil fuel heating systems. The initiative will prioritize schools in low-income as well as predominantly Black and Brown communities which are particularly vulnerable to environmental injustices such as elevated rates of childhood asthma. The electrification plan illustrates how NYC is using emissions data to combat climate change and disaggregated demographic data to promote equitable health outcomes.


How else has NYC become a more data-driven government?

As one of the first big cities in the U.S. to adopt climate budgeting, New York City is showing how new decision-making processes can deliver urgently needed change. 

In 2024, it will implement a formal climate budgeting intake form for agency budget requests and publish its first Climate Budget alongside the Executive Budget. The Climate Budget will include a citywide greenhouse gas emissions forecast showing progress toward the 2050 net-zero goal, as well as data that shows how capital project plans could affect climate goals such as air quality and heat and flooding resilience. The 100% compliance rate across departments is a positive sign for standardizing climate budget processes and understanding the City’s emissions.

Does climate budgeting make funding decisions more complex? Yes. But the initiative is worth it. It allows New York City to understand the climate impact of dollars spent and then rally around forward-looking projects aligned to must-reach goals.

“By using a data-driven decision approach, our administration is delivering results for New Yorkers in the most efficient and equitable way possible. Data is more than just a spreadsheet — it is a tool to help government better improve services that impact the daily lives of residents. I’m proud that New York City is recognized as an international leader in operations and look forward to continuing to use data to improve the lives of New Yorkers.”

Sheena Wright, First Deputy Mayor

Tempe, Arizona, USA


Project Type:
Communications, Cross-Sector, Health & Wellness, High-Performing Government, Infrastructure

2023 Platinum Certification

  • Launched Vision Zero, a data-driven traffic safety initiative with a goal to achieve zerofatal and serious injury crashes. The Vision Zero task force is composed of over 50 stakeholders including city departments (police, transportation, fire) and community stakeholders (Arizona State University, school districts, public health agencies) that conducted an analysis of crash data for the years 2012 through 2017. Using that data, the task-force created 37 transportation safety strategies, including the creation of four safety corridors based on statistical analysis of a higher propensity for collisions, plans for new road infrastructure, and community outreach plans.
  • Uses a performance-led budget process based on metrics, and resident and business satisfaction surveys. For example, following an increase in emergency service calls in the Salt River Bottom, an area with significant natural hazards and a large homeless population, an Incident Management Team was launched. In 2023, the City achieved several of its goals, including 66% of people engaged accepting shelter services and 52 tons of debris and over 3,200 tons of vegetation were removed. Based on these initial results, new, recurring funding has been allocated to support the City’s high priority “community health & safety” metrics.

2020 and 2021 Gold Certification

“I am enormously proud that our city has achieved Bloomberg Philanthropies What Works Cities Platinum status. This award shows our community that we are leaders in using data to guide our community’s future and make informed decisions. We can show people that our city has saved time and money and has been able to benchmark progress to our goals because of our commitment to data.”

Corey Woods, Mayor

Compiled data from the city’s sewage system monthly to track community drug use patterns and understand the depth of opioid use.


Using this data, monitored areas with high opioid use and deployed emergency response resources and abuse prevention interventions to hotspots accordingly.


Utilized similar wastewater testing data and tracking methods to monitor COVID-19 levels and identify outbreaks.

The Desert City’s Approach to Data

Like so many other cities in the country, Tempe, Arizona has been deeply affected by the opioid abuse crisis. The desert city of nearly 200,000 is part of Maricopa County, Arizona’s most populous area. This county also has the highest number of opioid-related deaths in the state.

As this public health emergency became more devastating in Tempe and around the country, Tempe’s leaders realized they needed to step up in two ways. First, they needed to be transparent about the severity of the problem facing the community. Second, they needed to create innovative solutions to help stem the opioid epidemic.

In 2018, the Strategic Management and Diversity Office, in partnership with ASU’s Biodesign Institute, submitted a proposal to the Tempe City Council Innovation Fund. The proposal focused on using wastewater to track the presence of opioid metabolites at the community level. City leaders supported the idea with innovation funds and began a partnership with ASU to tap this unlikely resource for data and to better inform decisions. Today, Tempe is on the cutting-edge of opioid abuse prevention work in the United States and has expanded this partnership to gather data on the presence of COVID-19 in the community.

“Cities may not want to call attention to opioid overdoses or abuse in their community,” said Wydale Holmes, a strategic management analyst in the city’s Strategic Management & Diversity Office.

“In Tempe, we’re courageously saying, ‘Yes, we have that, but we’re also doing something about it.’

It turns out that sewage offers an abundance of public health-related data — including a community’s drug consumption patterns. Tempe leverages its wastewater to identify areas of the city with elevated levels of opioid compounds — and then deploys emergency response resources and abuse prevention interventions to hotspots accordingly. All of this aligns to one of Tempe’s performance measures: ending opioid-related abuse and misuse by 2025, as measured by the percentage of 911 calls likely related to the drugs.

“Tempe is committed to data-informed community solutions. This first of its kind city model using wastewater-based epidemiology data informs strategic policy and operational decisions to advance community health.”

Director of the Strategic Management and Diversity Office Rosa Inchausti

It’s great to have data, but if you’re not doing anything with it or connecting it to resources and strategies for change, then it’s just information.”

Strategic Management Analyst Wydale Holmes

A New Diagnostic Matrix

Testing wastewater for real-time information about key markers of public health — everything from viruses to food contaminants to drug compounds — has been around for decades. But the approach is relatively uncommon in the United States. And no other city is trying to map the needs of residents around the opioid abuse epidemic in this way, said Dr. Rolf Halden, a professor at ASU’s Biodesign Center for Environmental Health Engineering.

“The United States is behind Europe. Every community that has done this work has not abandoned it, which is a testament to how well it works and how successful it is,” said Dr. Halden, who leads the wastewater data collection project in partnership with the City of Tempe.

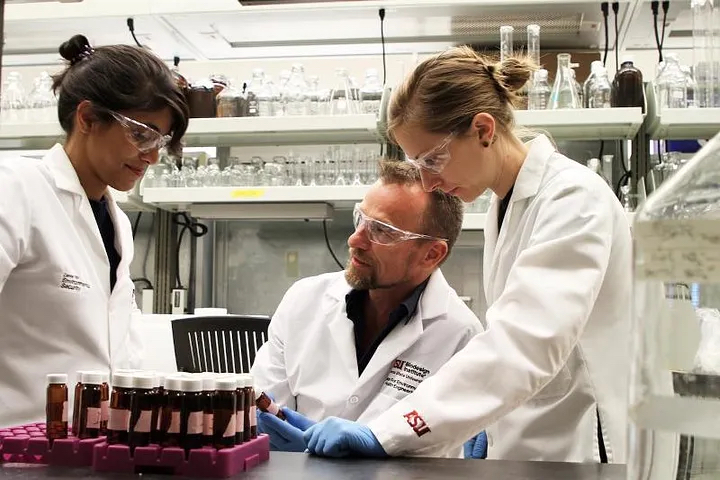
Dr. Rolf Halden and his team analyzing the wastewater samples.
Image courtesy of the City of Tempe.

Here’s how the wastewater analytics project helps the city identify opioid abuse hotspots and deploy resources strategically. Dr. Halden’s team takes raw sewage samples directly from five collection areas of the city for seven consecutive days each month. The scientists then test for four different types of opioids: fentanyl, heroin, oxycodone, and codeine.

After processing the samples, the ASU team hands off data to Tempe’s Enterprise GIS and Analytics team. The city can see where elevated levels of the four opioids are, and whether the opioids were metabolized or improperly disposed of. But the data contain no personally identifiable information — there is no way to tie data to specific addresses, neighborhoods or businesses.

Created by William Mancini for Fighting Opioid Misuse by Monitoring Community Health and provided courtesy of the City of Tempe.

All data are then published on the public Tempe Opioid Wastewater Collection Dashboard, created and maintained by Dr. Stephanie Deitrick, Tempe’s Enterprise GIS Manager. Through this dashboard and the Opioid Abuse Probable EMS Calls Dashboard, the information is analyzed by a multidisciplinary team, including Tempe’s Fire Medical and Rescue Department, to determine needed interventions. For example, if the data show a rise in opioid use among people under 18 in one area, the city might ramp up in-school outreach efforts. If one area suddenly becomes a major hotspot, the Tempe Fire Medical and Rescue Department can decide which emergency medical services and overdose prevention resources to move or increase to that area.

After implementing interventions, city officials can then track their potential effectiveness by monitoring changes in wastewater data alongside the EMS calls data. It’s a data feedback loop enabling the city to target its efforts — and, hopefully, prevent abuse and deaths.

“Dashboards allow people to quickly see overall trends within the data and to understand who is being impacted and where. Providing context is key when providing data to inform decision-making.”

Enterprise GIS Manager Dr. Stephanie Deitrick

Building a Data-Driven Culture

From its outset, the wastewater analytics project was directly tied to Tempe’s performance measure of ending opioid-related abuse and misuse. The Mayor, City Council, and City Manager set the expectation that reducing calls for opioid misuse or abuse was important to the executive leadership, and that both the goal and the performance measures supporting it needed to be shared internally with the City Council and administrative staff, community partners and externally to residents.

“Whatever we do, we always approach our employees and explain it to them and take the time to have the conversations about what we’re doing and why,” Tempe City Manager Andrew Ching said. “Every job has a purpose, and that job and that purpose exist within the framework of our strategic priorities and performance measures.”

City leaders also worked to communicate their efforts around the opioid abuse epidemic to the general public. The City of Tempe held an Opioid Town Hall in February 2019 to detail the wastewater project partnership and the types of support that Tempe provides to its residents struggling with opioids, their families and caregivers.

Anyone can visit the wastewater data dashboard and the Opioid Abuse Probable EMS Call Dashboard, designed and conceptualized by Dr. Deitrick and her team. The latter dashboard, which launched in 2018, gives Tempe Fire Medical and Rescue Department and the public a window into opioid abuse in the community. It details when calls related to abuse occurred, along with patients’ ages and genders, and the number of times Narcan/Naloxone overdose reversal medication was used during opioid-abuse related emergency calls.

Together, both dashboards inform Tempe officials’ efforts to end opioid misuse and abuse in the city, and help first responders and public health agencies on the ground see the impact of the targeted outreach and other interventions. It’s too early to tell how quickly the city will advance toward its goal — it was officially set in December 2019, when the baseline percentage of opioid-related EMS calls was 3.74 — but the right approach to data is in place to drive progress.

As the COVID-19 pandemic took hold around the world and in Tempe, city leaders have once again partnered with ASU wastewater researchers and are using this data in the same manner as the opioid data. The city is following the data to find areas of greatest need and is directing resources to help.

Join Our Certified Cities!

Phoenix, Arizona, USA


Project Type:
Community Engagement, Communications, Cross-Sector, Environment, Equity, Finance, Infrastructure, Public Safety

2023 Platinum Certification


Phoenix instituted data governance across departments and continuous community engagement to inform key policies, including the City’s climate action plan, contributing to the average Phoenix resident using approximately 34% less water today than the average resident in 1990.

2020 Silver and 2021 Gold Certification


Continually using data-driven planning and decision-making to prepare increasing temperatures and population numbers.


Crafted a narrative using date to make the case for increased funding for water infrastructure improvements, getting ahead of more costly potential future water shortages down the road.


Used automatic vehicle location (AVL) technology in garbage trucks to collect detailed data tracking pickup routes and analyzed which ways to pick up trash more efficiently, while maintaining safety.


Created HeatReady, a program that identified the highest temperatures and the lowest amount of shade cover, tracked and enabled equitable distribution of investment to support vulnerable areas exposed to extreme heat.

Rapid Growth in Phoenix

You might call it a good problem to have. Every single day between 2010 and 2019, the Phoenix metro area grew by about 200 people. Phoenix has been among the country’s fastest-growing cities for years, according to U.S. Census Bureau data — and it’s expected to double in size by 2040, up from nearly 1.7 million people right now.

“Phoenix was born to grow. For decades, since the 1950s, we have stretched our boundaries and reimagined what a modern desert city can be. And today, we are growing vertically as well. Strategic use of data has been an incredibly valuable guide as we continue to invest in infrastructure, technology, and services that ensure an equitable future for all residents.”

Phoenix Mayor Kate Gallego

All this rapid growth puts pressure on essential services — things like water, public safety, and waste management. Ensuring they remain reliable and accessible to all Phoenix residents takes careful planning that aligns infrastructure and services to where growing numbers of people live, work, and play. This is not a new challenge for the desert city, where the average daily high temperature is 86 degrees Fahrenheit. Phoenix’s population began taking off in the 1950s, when air conditioning became commonplace.

The city’s population isn’t the only thing on the rise, however. Climate change is pushing average temperatures higher in the Sonoran Desert, making Phoenix one of the fastest-warming cities in America. But not all residents feel the same heat. The hottest neighborhoods in Phoenix tend to correlate with lower-incomes.

With a hotter and more crowded future on the near horizon, the City of Phoenix is preparing through data-driven planning and decision-making. You can see this in how it is securing the most precious desert resource: water.

Staving Off a Drought With Data

One of Phoenix’s primary sources of water, the Colorado River, is becoming less reliable. City officials know this because they constantly forecast water availability while tracking regional demand and seasonal weather patterns, along with long-term climate change. The data doesn’t look good.

“Water is the lifeblood of any city, especially the fifth largest city in the nation located in the middle of a desert,” says Phoenix City Manager Ed Zuercher. “We have never taken water for granted. Continuous strategic planning throughout the decades, with data at the forefront, has allowed us to effectively manage potential supply challenges and opportunities for growth.”

With trend lines clear, city officials leveraged data to sound the alarm. Kathryn Sorensen, the Director of Phoenix Water Services, stood in front of the Phoenix City Council presenting data integrating economics, hydrology, geography and other subjects. An image of a black swan swam across the slides to underscore the possibility of a “black swan event.” Phoenix taps could run dry if the drought continued and the city remained so reliant on the Colorado River.

The Colorado River, one of Phoenix’s primary sources of water.
Photo by Mark Capurso courtesy of the City of Phoenix.

Elected officials never enjoy raising the costs of essential services. What Phoenix shows is that when the decision-makers have access to data that tell a clear story, hard decisions are made a little easier.

“Part of what we had to do to get the Council to fund big water infrastructure improvements was tell a story about what you’re getting, and why it’s worth it,” Zuercher says. In fact, by acting when it did, the Council avoided a more painful rate jump down the road, when water shortages might be imminent. “Because we started early enough with the 6 percent increase, we don’t have to do an 18 percent increase later,” he adds.

Smarter Trash Collection

Along with water, Phoenix’s rapid growth has increased demand for another basic service: trash removal.

Every 2,000 new homes typically requires a city to expand waste management services with an additional truck and worker, generally speaking. But impressively, for the past 11 years, as an additional 40,000 homes appeared in Phoenix, the city’s Public Works Department has not added one additional garbage truck, waste management worker, or increased collection fees. How did it pull this off? By using data to improve efficiency.

Using automatic vehicle location (AVL) technology in each of its garbage trucks, the city was able to collect detailed data tracking pickup routes across three months in 2019. It then analyzed those routes in search of ways to pick up trash more efficiently, while maintaining safety. Could school zones be avoided while school is in session? Could collection days for residents be strategically changed? Could dangerous left-hand turns be minimized?

AVL was implemented by the department 10+ years ago to fulfill the need of the operations team for real-time data and actionable data. In the beginning, installation of any AVL monitoring device on trucks was done using a phased approach since the collection trucks could not be taken out of service all at the same time. Nowadays, the newer solid waste trucks delivered to the city are already equipped with AVL monitoring devices and technology, per the city’s specifications.

With the help of AVL technology, the department was able to implement “New Way, Same Day” in 2012, which streamlined collections through route-balancing. “New Way, Same Day” allowed the department to collect trash and recycling containers on the same day, resulting in cost savings of about $1 million annually.

The operations team, in collaboration with the information technology and data services teams, have continuously updated and upgraded Phoenix’s AVL technology.

After diving into the geographical and logistical details, the team emerged with new collection routes that balanced safety requirements with the city’s pickup needs. This hadn’t been done since 2009 — a full 10 years prior. With strong communications about the reasons for change to both residents and the waste management workers on the ground, the department successfully updated its collection routes and systems.

Through data and efficiency, despite rapid population growth, the Public Works Department was able to maintain its monthly residential fee for trash and various waste diversion services for 11 years.

Just recently, however, the Phoenix City Council approved a rate increase to the monthly residential fee. Along with the increasing cost of providing a service, China’s stricter recycling policies, announced in 2017, greatly impacted the U.S. recycling industry resulting in a decline in Phoenix’s recycling revenue. The decline in revenue hindered Phoenix’s ability to maintain the current level of trash and recycling service it provides. But through an extensive community engagement effort to educate residents, the City Council felt confident that an increase in solid waste rates was needed to keep up with the demands of a growing metropolis.

“After more than a decade, the recent residential solid waste rate increase allows our department to maintain the same level of trash and recycling services our residents expect,” said Moreno. “We will continue to rely on good data to streamline our processes and make good decisions in managing our resources.”

Everyone Deserves Some Shade

Phoenix is the hottest major city in the United States, and it’s getting hotter. But rising temperatures threaten some residents more than others — parts of Phoenix are less hot than others due to the presence of shade and certain pavement materials.

To understand climate change’s impact on the city from an equity perspective, the city created HeatReady, a program to identify, track and respond to the dangers of urban heat. The program was funded through the Mayors Challenge, a Bloomberg Philanthropies initiative to help U.S. city leaders develop innovative ideas that tackle today’s toughest problems.

The first step was to gather basic data on heat across Phoenix. To do this, the city partnered with Dr. David Hondula, a professor at Arizona State University, who installed heat monitor sensors in eight locations.

“The Bloomberg Mayors Challenge really set us on course to begin coordinating all efforts to address the growing threat of rising urban temperatures in Phoenix. Data continues to guide us in identifying the areas of our city with the highest temperatures and the lowest amount of shade cover, enabling an equitable distribution of investment to support those most vulnerable to extreme heat.”

Deputy City Manager Karen Peters

Building on its long-standing partnership with Arizona State University, the city collaborated with researchers at ASU’s Urban Climate Research Center to gather and synthesize meteorological data from all across the city and install new sensors. Among the key findings: on the hottest days of the year, surface temperatures varied by up to 13 degrees between different neighborhoods, depending on greenness, shade cover, and other factors. The hottest spots were often in low-income communities. Dr. Hondula and his collaborators are now collecting long-term data in some of the city’s hottest neighborhoods to help the city track its progress over time in reducing heat inequities.

“Our partnership with the city on urban heat is a point of pride for the urban climate research community at ASU. We share the city’s desire to identify and prioritize the hottest and most vulnerable neighborhoods for future cooling investments. The opportunity to work in real-world settings also gives us unparalleled access to learn more about how the urban climate system works and how it can be improved, knowledge that we will work to translate into solutions with city and community partners.”

Arizona State University Professor Dr. David Hondula

The city plans to continue working with its partners at Arizona State University to place sensors throughout the city, and leverage data by strategically improving the built environment. For example, it will create shade in places where residents are in greatest need of walkable routes to public transit, and has begun resurfacing roads in pilot areas with lighter-colored pavement that doesn’t retain as much heat. There is potential for new buildings to be oriented to create better airflow and more shade in high-need places. The city continues to partner with non-profit agencies to offer cooling stations with free bottles of water and heat-safety information, at locations chosen based on heat data and public transit ridership.

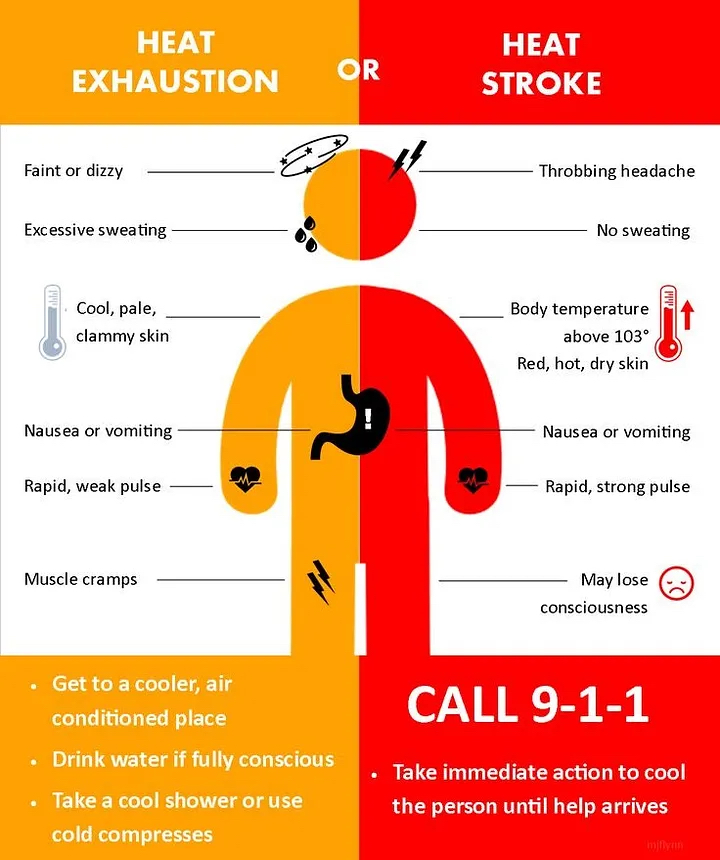
Phoenix’s flyer on the warning signs of heat exhaustion
Source: Phoenix Summer Heat Safety.

HeatReady has just begun — the city is currently seeking additional funding for the program and planning to implement a comprehensive shade and cooling plan built from gathered data. But the program already shows a valuable way forward for cities on the frontlines of climate change. The city and Arizona State University are in the final stage of the development of a HeatReady assessment to measure a city’s “heat readiness.” Phoenix will be the pilot city to complete the assessment this year.

Read more about Phoenix’s journey here.

Join Our Certified Cities!

Louisville, Kentucky, USA

Louisville: A Data-Savvy Approach, from LouieLab to LouieStat.

Project Type:
Community Engagement, Health & Wellness, High-Performing Government, Public Safety, Technology, Transportation

At a Glance


Created LouieLab so city employees, members of the civic tech community, and other innovators can come together to collaborate on how to achieve shared goals.


Evaluated and shared city departments work and progress with residents via Louiestat, their performance management data program.


Launched a data-driven program to ensure that former inmates were paired with social service providers upon release, lowering reincarceration rates.


Crowdsourced data on internet speed to assess the extent of the city’s digital divide and developed a digital inclusion strategy to remove the barriers keeping residents from jobs and resources.

Louisville’s Approach to Data

A loft-inspired space with exposed brick and a startup vibe isn’t what typically comes to mind when one thinks of a municipal building, but that’s exactly what the Louisville Metro Government has created in its LouieLab. The space is a hub where city employees, members of the civic tech community, and other innovators can come together to collaborate. It’s also a physical manifestation of the City’s efforts to open itself up to residents and strategize, together, on how to achieve shared goals for Louisville’s future.

Mayor Greg Fischer has a term for this: building social muscle. He believes that transparent communication fosters trust with the community. He’s embedded that philosophy throughout his approach to using data, from signing an open data executive order that considers public information to be open by default to launching the City’s LouieStat performance management program, which evaluates departments’ work and shares progress with residents.

Mayor Greg Fischer speaks at LouieLab, a hub where city employees, members of the civic tech community, and other innovators come together.

Chief Data Officer Michael Schnuerle knows firsthand the benefits of a strong social muscle. Cofounder of the local Code for America brigade, the Civic Data Alliance (CDA), he remembers, in the early 2000s, trying to articulate an idea. “I didn’t know what to call it yet,” he recalls. “I was making FOIA [Freedom of Information Act] requests, but I wanted a website where I could access information.” Years later, when such a tool still didn’t exist, he tweeted that, if the civic tech community had opened 311 data in real time, it could see where people are reporting downed trees and help the city more quickly assess storm damage. Mayor Fischer saw the tweet, liked the idea, and teamed him up with Louisville’s IT Services Department to help develop the City’s open data portal.

Soon after, Schnuerle found himself being hired as the twelfth chief data officer in the country. Since then, he’s worked to expand the City’s open data efforts both internally and externally, and cultivate the civic tech community he came from with data requests and hackathons. The City’s Innovation Team also collaborates on CDA projects like helping visually impaired residents access open data through voice-automated smart-home systems like Alexa. “We are so data-driven,” says Schnuerle. “The Mayor always emphasizes analytics. Whenever I talk to him, he always wants to know what the data is and how are we collecting it.”

For Chief of Performance Improvement Daro Mott, who oversees LouieStat, analytics are practically a way of life. His team has trained a staff member in every city department on how to embed the use of data in their work and then to report on their progress. Fundamental to this work has been responding to Mayor Fischer’s call for a culture of “weakness orientation” that focuses on where to improve. Mott explains: “It’s not just data show-and-tell. It’s about asking: ‘How do we use this data over time to fundamentally get better?’”

At a recent LouieStat meeting, the Department of Corrections turned to its numbers to discuss, with Mott’s team, strategies for reducing overcrowding in facilities and unscheduled overtime expenditures. These were complex challenges, and the solutions wouldn’t come easily, but the data were already helping to outline a path forward. Amid the troubleshooting, Mott made sure there was also time to recognize a key win: when data previously revealed high rates of recidivism among certain vulnerable populations, the Department launched a program to ensure that former inmates were paired upon release with social service providers. Now they were beginning to see declines in reincarceration.

“It helps set the tone for what citizens should expect.”

Louisville Mayor Greg Fischer

Now entering its seventh year, LouieStat is one of the nation’s longest-running CitiStat leadership strategies, and has 26 departments involved. His team trains hundreds of employees each year on how to use a data-driven, seven-step problem-solving process to improve. LouieStat is empowered by a Learn and Grow series, Louisville’s own version of Denver’s Peak Academy. The City’s goal is to make LouieStat the data-driven management system, not merely a series of forums or a program.

Mayor Fischer says that part of the City’s job is to celebrate success, but also to say where it can do better and then invite residents to be part of the solution. The City’s Innovation Team is finding creative ways to involve residents in tackling tough problems, sometimes by bringing them into the data-collection process itself. In one project, placing GPS-enabled sensors on asthma inhalers is helping to pinpoint areas throughout the city where low air quality is likely to induce asthma attacks. In another project, built at a CDA hackathon, crowdsourcing data on internet speed is helping the City assess the extent of its digital divide and develop a digital inclusion strategy to remove the barriers that are keeping residents from better jobs and other opportunities.

In Louisville, every staff member one talks to seems to share the belief that, with residents at the core and data to guide the way, there’s nothing they cannot accomplish. “We’re small enough to get things done but big enough to matter,” Mott says. A guiding philosophy of the Fischer Administration is the theory of the job: the job consists of daily work, continuous improvement, and breakthrough (innovative) work. “Our data-driven transformation starts and ends with all aspects of measuring the job, and we have a big job to do,” says Mott.

“What gets measured gets done, especially if you take action to improve it.”

Chief of Performance Improvement Daro Mott
Join Our Certified Cities!

Los Angeles, California, USA

Los Angeles: City of Angels Leads in Transforming Data into Action.

Project Type:
Community Engagement, Communications, Cross-Sector, Equity, Finance, High-Performing Government, Housing, Infrastructure

At a Glance


Published key metrics of success on the Mayor’s Dashboard allowing residents to see how the City is performing.


CleanStat measures quarterly, block-by-block assessments of the entire city to build data on and identify trends in street cleanliness.


After examining an index combining data of displacement patterns with predictive analysis, LA launched a campaign to raise awareness for tenants’ rights, reaching over 20,000 residents in the first year.


Open Data portal provide residents easy access to mapped sets of open data related to health, safety, schools and more.

How LA Measures Success

Los Angeles City Hall has a room with a view. Visitors who make their way to the building’s public observation deck can enjoy a vast panorama of the city below, home to some 3.9 million people. Inside City Hall, the permeation of what works practices is vast; one gets the sense that, after his election, Mayor Eric Garcetti came to the observation deck, looked around, and set out to determine how to embed data in everything the City touches.

That’s why one of his first moves as Mayor was to ensure that all 36 of the City’s General Managers develop key metrics of success for their departments, and then began tracking the data that would monitor progress toward their goals. Their progress is published on the Mayor’s Dashboard, where residents can see for themselves how well the City is performing — setting a new precedent for transparency in municipal service provision.

“Data shines a light on the problem and inspires targeted action. It allows us to be more proactive, more efficient, and more engaging.”

Los Angeles Mayor Eric Garcetti

CleanStat

As part of his Back to Basics approach, Mayor Garcetti launched CleanStat in 2016, so that all communities, regardless of their economic status, could enjoy clean streets. CleanStat, the nation’s most comprehensive street-by-street cleanliness assessment system, provides quarterly, block-by-block assessments of the entire city to build data on and identify trends in street cleanliness.

A sanitation worker assigns a cleanliness score to an LA street, part of the City’s Clean Streets initiative. (Photo credit: Los Angeles Times)

“When I came into office, my priority was to improve the quality of life for all Angelenos, and the use of data in assessment, monitoring, and implementation helped us achieve that,” says Mayor Garcetti. “Using data allowed our street-cleaning efforts to shift away from a reactive approach, and instead, focus on a methodical and equitable way.”

With CleanStat, staff from the Bureau of Sanitation drive all of the more than 20,000 miles of the city’s public streets and alleys, assigning a cleanliness score from 1 to 3 — or from clean to not clean — to every block, once a quarter. Those scores are added to the Clean Streets Index, where department officials can keep track of performance and residents can hold the City accountable for its goal to eradicate red grids (ones with a score of 3) by 2018. Residents who want to get more directly involved can sign up for the Clean Streets LA Challenge, with the potential to secure funding for a project to make their neighborhood cleaner.

Before and after a Clean Streets cleanup.

Because workers are generating service requests as they conduct assessments, the new approach is helping the department become more targeted in its response. Now, resources can be deployed to meet the specific needs of the site, and response teams can maximize efficiency. The department is also addressing between 4,000 and 6,000 service requests each quarter that wouldn’t have been called in otherwise, meaning streets are being cleaned more quickly. The results speak for themselves — just one year after its launch, the City had already reduced the number of unclean streets by 82%.

Rent Stabilization Ordinance Campaign

As in so many cities across the country, ensuring adequate access to affordable housing is a growing challenge in Los Angeles. Nevertheless, tenants living in any of the nearly 624,000 units covered by the City’s Rent Stabilization Ordinance (RSO) have many rights that aim to keep them in their homes, including protection from excessive rent increases. But when the City’s Housing and Community Investment Department (HCIDLA) began to survey residents, staff made an alarming discovery: nearly one third of renters and nearly as many landlords were wrong about — or were not even aware of — their rights and responsibilities under the RSO.

Data helped LA identify which neighborhoods to target with a campaign to raise awareness of tenant rights under the City’s Rent Stabilization Ordinance.

Through Mayor Garcetti’s Innovation Team (i-team) within his Office of Budget and Innovation, the City of Los Angeles launched a multi-faceted Home for Renters campaign in 2016 to raise awareness of tenant rights through direct outreach, the creation and distribution of easy-to-understand educational guidebooks, placement of PSAs, and more. To ensure the campaign targeted the most vulnerable residents, the i-team examined an index combining data of displacement patterns with predictive analysis on where displacement was likely to occur, mainly households with incomes under $30,000 and areas with high concentrations of RSO housing units and complaints. In its first year, the campaign has reached over 20,000 people online, and more through rigorous field outreach, multilingual handbooks, and strategic ad placement on city buses and benches — all with the goal of increasing the awareness of rights and responsibilities for tenants and landlords under the RSO.

More City Data, More City Solutions

A culture of data use has led to other notable developments, including a new portal tracking all city-owned properties so that staff across departments can better maximize available real estate assets when looking to develop new public amenities. A recent call for a Chief Procurement Officer demonstrates the City’s commitment to modernize the City’s procurement process in response to new technological advancements and data-collection capabilities. Through its Data Science Federation, the City is partnering with local colleges and universities to accelerate its use of data-driven tools at the same time that it’s creating a pipeline to bring new talent into local government. And the City is using data to see what works and what doesn’t as it pilots potential solutions to such challenges as police hiring, problem intersections, and the urban heat island effect before scaling them.

The City’s focus on data also aims to increase civic engagement with residents. Los Angeles’ open data portal greets visitors with an invitation to “find the data useful for you,” while the City’s GeoHub empowers residents with quick access to mapped sets of open data related to health, safety, schools, and more. These efforts are as much about fostering transparency as they are about working to build relationships with residents centered on collaboration and problem-solving.

“When the City gives residents the information to discuss our challenges, we are opening the door for them to help us work towards the right solutions. Los Angeles is a city that leads, and we are proud to pave the way for greater inclusion, opportunity, and equity for our residents in an era of accessible data that’s also ripe for innovation.”

Los Angeles Mayor Eric Garcetti

Join Our Certified Cities!

Disclaimer