Boise, Idaho, USA
Recycling Wastewater to Build a More Resilient Future
Project Type:
Communications, Community Engagement, Infrastructure and Utilities
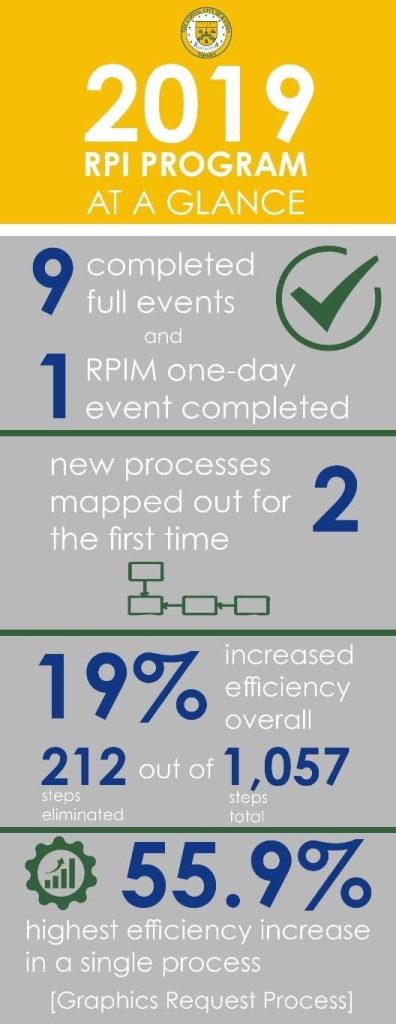
At a Glance
$570 million: Bond amount voters approved with 81% support in November 2021, funding Department of Public Works Water Renewal Services projects slated through 2030.
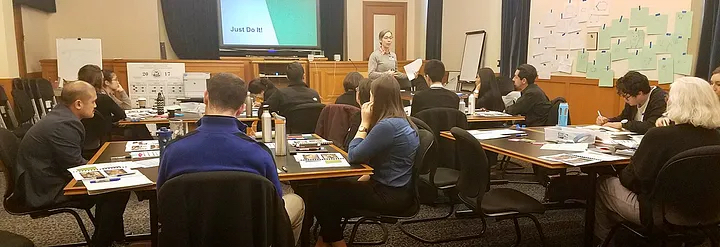
50+: Number of open house events held at the city’s water recycling pilot site
6 million gallons: Amount of additional water Boise will add to its renewal capacity each day when fully its Recycled Water Program is implemented, strengthening the city’s resilience against drought, population growth and climate change.
2029: Year the brand-new water recycling facility is slated to open.
In Boise, climate change and population growth all pose a long-term challenge to the most precious natural resource: water. The city of about 247,000 people draws 70% of its water from aquifers and 30% from the Boise River. Both water sources are under growing stress due to rising demand for irrigation, shrinking snowpack and increasing drought frequency.
To build resilience and support growth, the City of Boise has embraced water recycling. In 2020, the Department of Public Works’ Water Renewal Service utility issued a data-driven strategic plan to ramp up Boise’s water recycling capabilities over the next 10 years, with a new focus on aquifer recharging. A centerpiece of the plan is construction of the city’s first recycled water facility.
City leaders have worked to rally Boise residents around their vision to ensure an adequate supply of water for both residential use and new businesses. They built buy-in various ways. The City held over 50 community meetings to show trade-offs of water treatment models to address limited water supply. The result was a $570 million bond measure that passed in 2021 with voters’ overwhelming support (81% voted in favor). This allowed the City to move on major water renewal capital projects, including a new $420 million water recycling facility, with minimal sewer user fee increases.
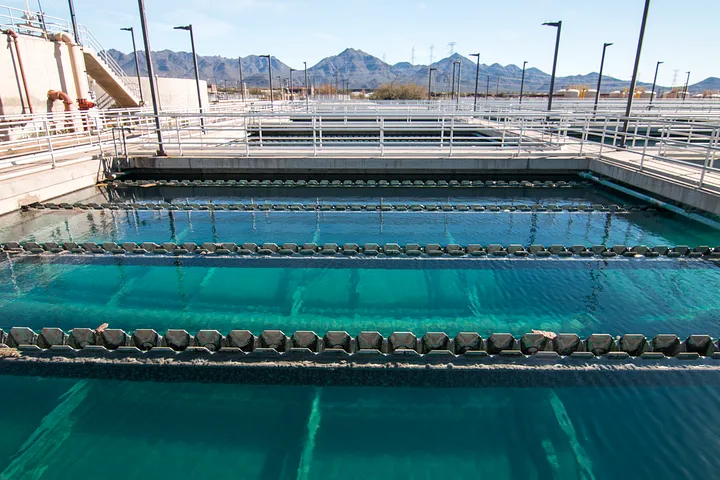
Leaders also leveraged the annual budgeting process to build stakeholder support. In recent years the City’s budget has included tens of millions of dollars in water renewal capital project investments, including for an advanced water treatment pilot to test new technologies. The pilot site, which opened in 2023, tests five different filtration technologies including reverse osmosis and ultraviolet advanced oxidation, to remove all chemicals and pollutants from industrial wastewater. Notably, one goal for data from the pilot is to build trust with residents. The City aims to show that the recycling treatment will produce safe water for the community.
As Boise city officials and residents deepen their knowledge of innovative filtration technologies, which aren’t common in Idaho, a more resilient future is coming into view. In February 2024, the City purchased a 76-acre plot of land where it will build the new state-of-the-art recycled water facility. Construction will start in 2025, a key step toward a more sustainable Boise.

“The open houses we’ve done with community engagement of this pilot, the ability to show people the technology and talk about it, is really incredible.”