Newark, New Jersey, USA

A Group Approach to Violence Prevention

Project Type:
Public Safety, Cross-Sector Collaboration, Community Engagement

At a Glance


Established a coalition of over 50 cross-sector partners to share and strengthen public safety and infrastructure data, which led to a 25% decrease in homicides in 2024 compared to 2023.


36% decrease in auto thefts in 2024, compared to 2023. Neighborhood hotspots have seen drops of 55%.


5% of Newark’s blocks account for the majority of violent crimes in the city.


50+ organizations that are part of Brick City Peace Collective, which coordinates Newark’s violence prevention ecosystem.

When the right data gets to the right people, significant change is possible. That’s what the City of Newark has pioneered with its groundbreaking approach to reducing violence. The city of more than 300,000 residents has become a national model in shifting responses to violence to be more data-driven, collaborative, and focused on violence as a public health challenge.

Newark’s Police Division works alongside The Office of Violence Prevention and Trauma Recovery (OVPTR), a community-based public safety entity. Under this umbrella is the Brick City Peace Collective (BCPC) that coordinates an ecosystem of more than 50 organizations working to reduce violence and increase wellbeing. Under Mayor Ras J. Baraka’s leadership, the collective launched in 2020 to coordinate and share data analysis, design interventions, and strengthen relationships between law enforcement and residents. BCPC partners include nonprofits, grassroots organizations, city agencies and the Newark Public Safety Collaborative (NPSC), an initiative of Rutgers University-Newark’s School of Criminal Justice.

Image Courtesy of the City of Newark.

“When we bring data into the conversation to understand where violence does and does not happen, we can start to move past misinformation, stereotypes and stigma, and redefine what Newark is and can be.”

Jessiah Paul, Director of Brick City Peace Collective

“Through measurable and data-driven outcomes, we can decrease violence and ultimately save and change lives.”

Mayor Ras Baraka

With NPSC providing key data analytics support, BCPC members meet regularly to discuss trends and share insights, including crime hotspots and to develop response strategies. Take bodegas: In 2023, 53% of shooting incidents occurred within two blocks of several identified small corner stores. BCPC members then zeroed in on the 10 bodegas most associated with gun violence. Additionally, further data analysis illuminated what time of day shootings were most common near stores.

By utilizing data, the city can implement targeted responses rather than relying on generalized strategies. Responses built around this kind of data involve much more than police patrols. For instance, Newark’s power utility, PSE&G, may prioritize street lighting improvements if data correlates violence with darker streets. Staff from community-based organizations conduct targeted outreach walks, actively engaging local residents to better understand what a particular neighborhood is experiencing and needs.

All data, including information gathered through community outreach, goes into the City’s data management platform, which is accessible to all BCPC members. The platform also supports the City’s belief that violence prevention should be about more than policing: Through the platform, the Police Division is able to alert community support officers when crime victims or other residents may need mental health and other stabilizing services.

Image Courtesy of the City of Newark.

With weekly data reports highlighting the location of crimes and social service needs (based on referrals), social service organizations in BCPC are able to ramp up targeted outreach and community engagement efforts. Compared to five years ago, Newark’s violence prevention leaders no longer feel they’re playing catch-up. Instead, through disaggregating data to understand crime patterns and disseminating the analysis among coalition members, public safety strategies can be effectively co-produced by BCPC partners.

Strategies to prevent homicides and auto thefts (which spiked in 2023) are working as planned. Newark has seen a 25% decrease in homicides and a 36% reduction in auto thefts in 2024, compared to 2023. Juvenile arrests are also down. It’s no surprise that other cities across the country have visited Newark and looked to the city to learn about its comprehensive approach as a valuable violence prevention model. Their success is proof that data-driven collaboration can power on-the-ground progress.

Join Our Certified Cities!

Hamilton Canada

A Data-Driven Approach to Innovative and Collaborative Solutions for City Operations

Project Type:
Community Engagement, Cross-Sector Collaboration, Education

At a Glance


237 CityLAB projects completed since 2017


156 City staff members involved in CityLAB projects since 2017

Complex challenges can be overcome through creative collaborations grounded in data. That’s a core premise of CityLAB Hamilton. This innovation hub in the Lake Ontario city unites government, academic leaders, and students to conduct research, gather data and propose evidence-based solutions. Since 2017, hundreds of CityLAB projects have tackled a range of challenges—from housing to city hiring practices to bike infrastructure—with support from more than 4,100 students across Hamilton’s three post-secondary academic institutions. CityLAB Hamilton facilitates strong and meaningful partnerships that enhance mutual understanding of City processes and encourage a more open and transparent government through collaborative problem-solving.

Each project starts with City staff, who identify a specific work-related challenge and request a deliverable aligned with a City strategic priority. CityLAB’s Program Committee then matches the project with a faculty member at Mohawk College, Redeemer University or McMaster University who integrates the project challenge within their coursework. A professor then guides a team of students as they research the problem, collect data, conduct fieldwork, and pilot and/or recommend solutions.

CityLab students. Image Courtesy of the City of Hamilton.

Case in point: one project assessed the risk and impacts of extreme heat on city facilities in Hamilton, which faces rising temperatures due to climate change. A group at Mohawk College mapped at-risk facilities and made recommendations for energy efficiency and cooling strategies, as well prioritization criteria for mitigation efforts. Other projects have focused on optimizing public transit services, analyzing city hiring practices to foster diversity, equity, and inclusion, closing the gender gap among Hamilton cyclists, and assessing the feasibility of pole-mounted WiFi networks in public spaces.

One key benefit of CityLAB for the City of Hamilton is that the program lowers the risk of investing in new solutions. With more than 60,000 student hours dedicated to City-identified needs, student project teams conduct research and (in some cases) prototype new approaches, helping the City to identify evidence-based strategies for the City. By leveraging student expertise, the program reduces City research and data costs, creating efficiencies that benefit taxpayers. At the same time, students directly apply their skills and knowledge in real-world scenarios, expand professional networks, and develop a deeper connection to their municipal government while improving the City.

CityLab Student Showcase. Image Courtesy of City of Hamilton.

In 2022, CityLAB’s success propelled it to become a permanent city program after five years as a pilot effort. In many ways, it serves as an external research and innovation hub that supports performance evaluation and fosters a culture of data-driven decision-making and governance. And it’s just getting started.

“I’m proud of our team for their dedication to building a stronger, more responsive city. At the end of the day, this is about making life better for the people who live in, work in, and visit Hamilton. By using data in smarter ways, we can solve problems faster and improve the services we deliver. And this is just the beginning of what’s possible!”

City Manager Marnie Cluckie

“I am so proud of the City of Hamilton for earning the Silver What Works Cities Certification for 2024. This recognition highlights our commitment to using data-driven decisions to enhance customer service, transparency, and efficiency for all Hamiltonians.”

Mayor Andrea Horwath
Join Our Certified Cities!

Caruaru, Brazil

A Data-Driven Approach Yields Progress on Early Childhood Development.

Project Type:
Community Engagement, Cross-Sector Collaboration, Education, Health and Wellbeing, Parks and Recreation, Youth Development

At a Glance


Launched a 10-year Municipal Early Childhood Plan with 60 goals for the health and wellbeing of expectant mothers and children ages 0 to 6.


The City is making measurable progress on key metrics, including rates of teen pregnancy, maternal mortality and congenital syphilis.


A new community center is the heart of municipal services, professional training, policymaking and research on what works related to early childhood development.

The sparkling new community center that opened in Caruaru in April 2024 is a unique headquarters for all things early childhood. Within its walls, expecting mothers get health checkups and prenatal care, teachers get professional training, parents learn positive parenting techniques in dedicated classes, and there’s no shortage of play areas for children to climb, tinker with toys, or make their way through a stack of picture books.

However, the space is more than a vibrant community center. It’s also a health and education research and collaboration hub, aimed at learning what works in early childhood, a critical time for brain development. The center and its programming relied on best practices (such as disaggregating data) from Urban95, an initiative that elevates children’s perspectives in urban planning. Learnings from the center will spread to the growing number of municipally run daycare centers springing up around the city of 400,000 near Brazil’s eastern tip.

Children play at the new Caruaru’s new community center.

These centers are the most visible products of Caruaru’s data-driven 10-year plan for early childhood, which kicked off in 2018. But there is much more behind the scenes. That plan includes 60 goals tied to measurable results. It’s bearing fruit. The number of cases of syphilis passed from pregnant mothers to their babies declined from 79 in 2022 to 19 in 2023, thanks to stepped up testing and treatment. Rates of teenage pregnancy are down 6 percent since 2022, and the number of pregnant women who died before, during, or soon after childbirth dropped from three to zero.

New parents receive support at Caruaru’s community center.

“Whether it’s health, education, social assistance, or other City Hall services, we have an obligation to deliver with quality. Data helps us measure how we are progressing and whether our investments are paying off.”

Caruaru Mayor Rodrigo Pinheiro

Two things stand out in Caruaru’s approach. One is a commitment to engaging residents — and children themselves — in the childhood development effort. A diverse advisory committee of 20 children between the ages of 4 and 12 meets regularly to discuss things they’d like to see in the community. Current priorities include creating a new water park, more activities for kids during an annual local festival and cleaning up the local river.

The City of Caruaru convenes the Comitê das Crianças (Children’s Committee).

The other standout is the way agencies across city hall, including health, education, planning and others, collaborate to get results. In fact, there are meeting spaces at Caruaru’s new community center specifically meant to be places where public-sector and nonprofit leaders can team up on youth and family initiatives. Caruaru’s shared, data-driven approach helps different partners stay focused on the results they are working to achieve together. “We do it in an intersectoral way,” says Mayor Rodrigo Pinheiro. “All the departments meet and work together.”

“Certification is extremely important for us to inspire a regional culture of using data. If we can do it in Caruaru, it will be replicated in 50 other cities in the region. By serving as an example, we can spread a culture of data-driven governance to other municipalities in our region.”

Dimitri Bezerra Almeida, Procurador-Geral de Caruaru
A young member of Caruaru’s Comitê das Crianças (Children’s Committee).

60 goals Caruaru's 10-year Municipal Early Childhood Plan includes 60 goals.

Join Our Certified Cities!

Issaquah, Washington, USA

Data Helps Issaquah Close Gaps in Homeless Services

Project Type:
Community Engagement, Equity, Housing

At a Glance


Staff from the City’s Homeless Outreach program had 1,555 interactions with unhoused community members between September 2021 and January 2024. On average, it takes four to five interactions with a person before they consider accepting services.


Created and launched Data Quah, a data training program for staff. All new hires participate in Data Quah 101 to learn about the City’s data collection and tracking systems. Over 50% of staff engaged with Data Quah in its first year.


Monitored crime trends and partnered with local businesses to gather and share data. In 2023, burglaries fell by 37% and thefts by 26%.


Using data to show how investment in the arts promotes tourism and economic development. The City tracks requests for arts grants, providing insight into community-wide needs and allowing for more strategic funding decisions. (Jakob is a city art highlight.)

Staff from the City of Issaquah’s Human Services team first met John in September 2021. At the time he was camping under bridges and had been homeless for four years. It took repeated meetings to build enough trust with John to begin the process of finding him a permanent home. With the help of the City, federal rental assistance and family, John moved into an apartment in March 2022. 

John is one of 37 people the City has helped move into permanent housing since it began its Homeless Outreach Program in June 2021. It has also provided unhoused community members with over 1,000 connections to services, such as temporary shelter, transportation and medical treatment. 

The Homeless Outreach Program started with a goal of filling information gaps about homelessness in Issaquah. Data collected by the Human Services team showed that homelessness was more prevalent than originally thought, and that shelter, treatment and affordable housing were needed in Issaquah. These findings were incorporated into the first-ever Human Services Strategic Plan, which includes goals and action steps for effectively responding to homelessness. In 2022, the City began using an online dashboard to track data from the Homeless Outreach Program and share timely updates with the community. 

“We’ve got some good data over time. But are we really able to tell that we got the outcome that we were trying to? Not just that we tried, but that we moved the needle.”

Mayor Mary Lou Pauly

Trends emerged from the data. Because Issaquah didn’t have an emergency shelter, people had to leave town for a bed, something many did not want to do. Even when they were willing to accept shelter, 43% of the time no beds were available in the regional shelters. To fill the need, the Homeless Outreach Program began collaborating with a local hotel franchise to provide emergency shelter during extreme winter weather.  

The initiative was modeled on a successful hotel-based emergency shelter program King County ran during the pandemic to reduce the spread of COVID-19. Human Services staff found that people were more likely to accept shelter in a motel room in Issaquah during extreme weather than other shelter options. The stability of the motel also allowed staff to engage more consistently with individuals, build trust faster and make quicker progress on service goals.

Seeing the positive outcomes, the City proposed expanding the collaboration with the motel beyond short-term shelter and into emergency housing. Data gathered from the homeless outreach encounters led to the City Council’s approval of a pilot program. The pilot program dedicated 12 rooms in the motel to supporting community members as they move from homelessness to permanent housing. The Human Services team, in partnership with the City’s Performance Program Analyst, will continue to collect and analyze data, look for trends, and evaluate whether their approach is alleviating homelessness in Issaquah.

1,073 connections to services, including temporary shelter, basic needs and transportation

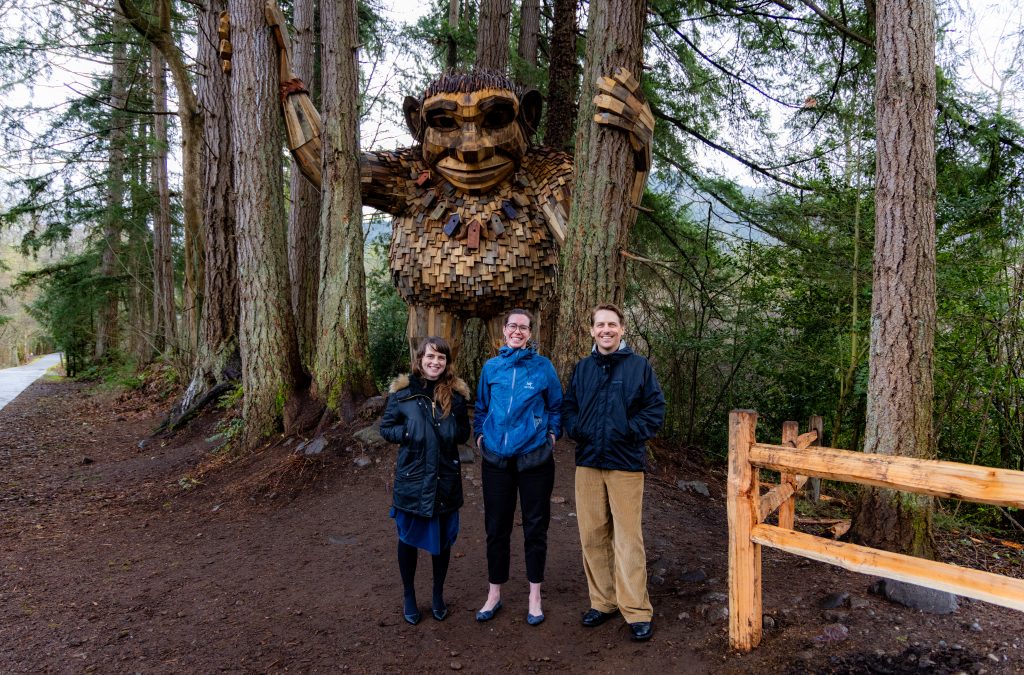
From left WWC’s Emily Ferris, Issaquah’s Assistant to the City Administrator Dale Markey-Crimp, and WWC’s Jake Hemphill in front of Issaquah’s troll, Jakob Two Trees. Jakob is one of six trolls that form a large-scale public art installation.

“I was approved for a voucher to find housing. They did that for me!! The City of Issaquah rescued me but that’s only part of it. The man, Amir, who helped me went above and beyond the call of duty. He drove me places to apply, he paid deposits and holding fees. He started out as a case manager, but I consider him my friend.” 

John, Issaquah resident who experienced homelessness

Join Our Certified Cities!

Rochester, Minnesota, USA

Breaking Down Barriers to Build a Diverse Workforce.

Project Type:
Community Engagement, Finance, Health and Wellbeing, Infrastructure, Public Safety, Transportation

At a Glance


Among 631 entries from around the globe, Rochester was one of only 15 cities to be awarded a $1 million grant from Bloomberg Philanthropies’ Mayors Challenge in 2021.


Established Equity in the Built Environment, a flagship program to increase workforce participation for women of color in built environment industries

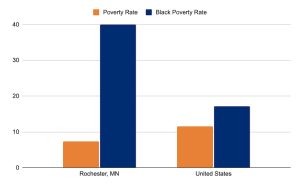
Overall, Rochester, MN’s poverty rate is part success story, part call for action. The city’s 7.4% poverty rate is well below the national average of 11.5%. But equity is top of mind for city leaders, and when they dug deeper to examine who in their community are struggling, they found an alarming disparity. Four in ten Black Rochester residents live in poverty—far above the citywide rate and more than double the national poverty rate for Black Americans. City leaders recognized addressing such a large disparity required a new way of thinking and fundamental changes. 

In 2020 the City of Rochester named Chao Mwatela as the first Diversity, Equity and Inclusion Director. Instead of coming in with a laundry list of action items, she began by identifying potential priority areas using disaggregated data. Then, Mwatela focused on building relationships and listening. She spent time learning about past equity efforts and made recommendations based on what she heard from residents, City staff, and community organizations. A consensus emerged that in order to create a more equitable Rochester,  intentional engagement of the community members most impacted should take priority—this practice is a critical component of WWC Certification.

Also in 2020, the City participated in the Bloomberg Global Mayor’s Challenge which asked cities to identify new solutions for a persistent problem in their city. Rochester identified a problem and an opportunity – inequitable access for women of color to well-paying built environment careers. Nationally, women occupy about one in 10 construction jobs. In Southeast Minnesota, women of color are employed in less than 2% of built environment careers yet represent 13% of the population. As home to the renowned Mayo Clinic, Rochester is undertaking a $5.6 billion public-private economic development plan to elevate the city and solidify its standing, globally, as a leader in healthcare and medical research. Community groups, City leaders, and DMC stakeholders recognized that intentional growth should prioritize equitable results, so everyone in the community benefits. One opportunity, made clear by the data, is for Rochester to recruit more women of color in built environment careers to meet these ambitious construction plans.

Together–using a co-design methodology–women of color and built environment professionals, along with representatives from Rochester Schools, Workforce Development Inc, and the City of Rochester created the Equity in the Built Environment program.

The program includes:

  • K-12 career exploration,
  • Training and mentorship for women of color,
  • Inclusive Workplace Employer (I/WE) designation for built environment employers hiring from the program, and
  • Entrepreneurship support for women of color starting a built environment business.
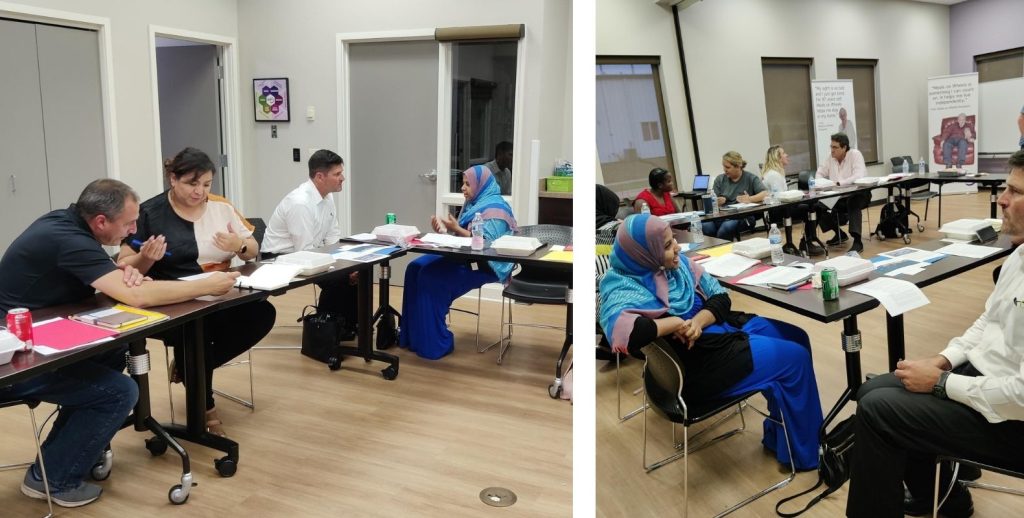
Photo Courtesy of the City of Rochester

Their efforts have been recognized. In 2021, Rochester was one of 15 global cities to receive a $1 million grant as part of the Bloomberg Philanthropies Mayors Challenge. Their award is focused on building a system that creates access to women of color into built environment careers. This system consists of education, workforce development, trades unions, and private employer partners all working in collaboration to ensure success for women of color. As of January 2024:

  • Four commercial construction companies earning their Inclusive Workplace Employer designation.

  • Thirteen women involved in built environment training or entrepreneurship .

  • Over one hundred 11th grade students were exposed to built environment careers through experiential learning economics curriculum.

  • A built environment framework now supports women of color on their chosen career path from training to employment and beyond.

 More than anything, Rochester’s data story is about using data to see innovative ways to solve problems and create opportunities. It’s about economic growth being a benefit for all residents and a catalyst for equity. While the program is early in the implementation phase, it’s poised for success. By developing solutions with residents, the City has used data to create pathways to high-paying careers, enhancing economic mobility for historically marginalized communities.

“Aggregate data is meaningful, but does not tell us the stories and experiences of specific communities – those most impacted in our communities. It is imperative that we disaggregate data to understand impacts to specific groups and communities.”

Chao Mwatela, Diversity, Equity and Inclusion Director

“What Works Cities Certification shows the community that our staff are not only trained and certified in the use of data, but that we’re actually using data to make progress and being recognized for it. In a time of widespread distrust of government, having What Works Cities Certification is a chance to increase trust in government.”

Kim Norton, Mayor

Join Our Certified Cities!

Washington, DC, USA

Washington, D.C.: Excelling in Evaluations for Better Outcomes.

Project Type:
Community Engagement, Cross-Sector, High-Performing Government, Public Safety

At a Glance


Established a team of research scientists who deliver data-driven insights and analysis to inform District policymakers.


Increased data transparency with residents by publicizing CapSTAT meetings, welcomed online public opinion on data policy, and built feedback loops monitoring solutions.


Developed a command center within the Metropolitan Police Department that uses real-time data to analyze similar crimes, trends, and background for detectives in the field, which helped decrease all crime by 11% and violent crimes by 22%.


Analyzed data from resident interactions with the 311 system to eliminate inefficiencies, allowing the District to implement measures that have achieved a 90-second response time for 85% of calls made to 311.

More Than the Nation’s Capital

Whether it’s enabling residents to send text messages to 911, establishing a leading “open by default” policy for all District government data, or establishing a unique, in-house team of data scientists, Washington, DC, is using technology and data to improve its delivery of services and outcomes for residents.

“In the District, we expect our agencies to engage in fact-based decision-making. We understand that our decisions affect the lives of our nearly 700,000 residents, and we always want to know how well our policies and programs are working so that we have the opportunity to learn and adjust while we act. As we continue building a safer, stronger, and more resilient DC, we will continue to use data and scientific thinking to improve our day-to-day operations and deliver good government.”

Washington D.C. Mayor Muriel Bowser

As part of her commitment to data, Mayor Bowser charged City Administrator Rashad Young to stand up The Lab @ DC, a team of applied research scientists who use data and scientific insights and methods to provide timely, relevant, and high-quality analysis to inform the District’s most important decisions. The Lab completed the District’s high-profile study of the impact of body-worn cameras on policing, and it is now studying the effectiveness of the District’s rat abatement program. While these two subjects are very different, they demonstrate the capacity of data to inform a range of decisions.

The District’s in-house team of data scientists, The Lab @ DC, recently tested the effects of police body-worn cameras.

Monitoring how agencies collect and use data is part of quarterly cluster performance meetings hosted by the Office of Budget and Performance Management. As part of these sessions, City Administrator Young reviews progress toward milestones and mayoral priorities along with the agencies’ implementation of data-based decision-making as part of their internal processes. The sessions also provide agencies with an opportunity to showcase successes and lift up obstacles.

“Managing a $13 billion, 35,000-person government is nearly impossible without accurate metrics to lead our decisions. These quarterly sessions ensure we are being good stewards of District resources, that we are keeping our commitments, and that we are evaluating and redirecting if our approaches are not rendering quality results.”

City Administrator Rashad Young

During a quarterly cluster meeting last year, reviews of the 311 system revealed that there were no standard definitions of open and closed cases across city agencies, no standard response times, and in certain instances, it was taking more than four minutes for calls to be answered. The agency was charged with developing a plan to address the significant lag times. After hiring additional staffing and providing extensive training as well as additional outlets for contacting 311 (via text and a smartphone application), the agency was able to achieve a 90-second response time, 85 percent of the time.

“Mayor Bowser and City Administrator Young embrace the use of data across our government agencies. This expectation motivates agencies to be on the ready with sound, reliable data to support program recommendations and initiatives. Agencies also understand that much of their data is now publicly accessible through our open data laws.”

Director of the Office of Budget and Performance Management Jennifer Reed

In April 2017, Mayor Bowser announced the signing of an executive order, creating a new policy that set an “open by default” standard for all District government data, including a directive to treat the City’s data as a valuable resource. The policy was based on recommendations made by What Works Cities partner the Sunlight Foundation, and provides a framework to make government more transparent and open while improving the quality and lowering the cost of operations.

The District has extended its commitment to data transparency by inviting residents to view the budgeting process, welcoming public opinion on its data policy, and building in feedback loops so that residents know when their problems have been addressed. The Mayor’s CapSTAT meetings — data-driven management tools designed to tackle timely policy issues and processes with analysis, mapping, business process reviews, and best practices — are also videotaped and shared with the public.

The Metropolitan Police Department embraced the use of data in past years as a tool for improving public safety. The Joint Strategic and Tactical Analysis Command Center pulls together real-time, robust analyses of similar crimes, trends, and background for detectives in the field. The department recently reported an 11% decrease in all crime, which includes a 22% decline in violent crimes.

“We’re delivering people the services they want and improving service delivery.”

City Administrator Rashad Young

City Administrator Young says, attributing the City’s use of data for much of that progress. Agencies ask for help unraveling particular challenges, and data and performance management experts are assigned to assist. For multifaceted challenges, resources from The Lab may be assigned to analyze the challenge and the path forward. Recently, the Department of Consumer and Regulatory Affairs experienced such a challenge when working to make the permitting process more efficient.

While data may not tell the full story, it gives agencies and decision-makers valuable insight into the District’s toughest challenges. City Administrator Young noted, “Fully utilizing data and evidence is the only way to really manage and have a rational sense of what you’re doing. Anything less feels random, and without context.”

Learn more about Washington D.C.’s journey with data here.

Join Our Certified Cities!

Tulsa, Oklahoma, USA

Tulsa Scales Up Data-First Innovation.

Project Type:
Communications, Cross-Sector, Economic Development

Tulsa most recently achieved 2024 Silver What Works Cities Certification. The following narrative was written for Tulsa’s 2020 Silver What Works Cities Certification. Some content may be outdated. For the most current information, please visit cityoftulsa.org.

At a Glance


Created a cross-departmental team that identifies the most effective methods for achieving the city’s top goals and leads the city’s data-driven transformation.


Found patterns in 911 repeat call data that signaled the need for a new referral program to deliver specialized healthcare and social services for residents. Within the first three months of launching the program, there was a 70% reduction in calls from its top 911 utilizers.


Partnered city agencies and civic tech nonprofits to develop a text reminder system that reduced missed fines and warrants that have helped the City’s Court see an annual 187,000 increase in revenue.

Using Data to Power Innovation

G.T. Bynum has leadership in his veins. One of the youngest people ever elected mayor of Tulsa, Oklahoma, he’s the fourth person in his extended family to serve in the role since the turn of the last century. But he is the city’s first mayor to place data-driven decision making at the top of a change agenda. Since becoming mayor in December 2016, his administration has marked a turning point in how Tulsa uses data to power innovation and improve the quality of life in Tulsa.

Mayor Bynum didn’t waste any time after being elected. The idea of improving city services and using data to make key decisions was at the core of his mayoral campaign. One of his first moves as Mayor was the creation of the Office of Performance Strategy and Innovation (OPSI). The office works to align the city’s top goals with effective strategies. It quickly became key to the city’s data-driven transformation, says James Wagner, who led OPSI at its inception and is now the city’s director of finance and CFO.

Ben Harris, OPSI’s Data Analytics Manager, convened a team of employees from 16 departments to lead the city’s data governance and strategic planning efforts. The Data Governance Committee, which sets the standard and strategy for data quality, integrity, and use for the city government, has helped integrate the use of data citywide through the creation of a Central Data Repository where any employee or resident can request data.

“Through this cross-departmental team, we encourage transparency, access to data, and a feedback loop; ultimately it creates a trust relationship between departments,” Harris said.

“In addition to teamwork, technology played a huge role in orchestrating communication, automating data movement, securing data, and making it accessible.”

Data Analytics Manager Ben Harris

OPSI and the Committee also facilitate regular sessions with department leaders to focus on the value of performance metrics. These meetings aren’t just about tracking progress reviewing data — they’ve created a new space within the city to cultivate innovation.

“Mayor Bynum and other city leaders have consistently looked to OPSI to drive data-driven innovation work in Tulsa. This matters because we’re making real changes that improve city services and save taxpayers money.”

Chief Financial Officer James Wagner

A Caring Fire Department

For years, the number of calls to the Tulsa Fire Department was increasing, putting stress on their resources and capacity. By analyzing the data, the fire department discovered the source of the increased calls was not an increase in fires, but instead an increasing aging population who needed lift assists. Lift assists are calls to the 911 system for a non-emergency fall — the help the resident is requesting is to literally be picked up off of the ground. The city discovered a repeat lift assist pattern, with some residents requesting a lift assist as many as nine times a day.

Under the direction of Chief Michael Baker, the Fire Department developed and launched the Tulsa Community Assistance Referral and Educational Services (CARES) program, which was designed to connect high-utilizers of the emergency system to healthcare and social service providers. Visits to the highest utilizers became proactive, with the CARES team working on simple fixes such as installing low-cost solutions like handrails and opening up a dialogue with the resident’s primary care doctor. Within the first three months of the pilot, the fire department saw a 70 percent reduction in calls from its top 911 utilizers.

With preliminary results in hand, Baker presented his findings through the TulStat forum.

“TulStat,” based on the successful “LouieStat” program out of Louisville, Kentucky, has created a forum for change in Tulsa. City leaders gather to discuss priority problems, define success, innovate solutions, and develop methods for measuring progress. They identify specific, quantifiable goals, such as average time for reviewing building permit applications (previously 5 weeks, now 92 percent completed in 5 days) or responding to a 911 call, and troubleshoot obstacles to achieving them.

While CARES was developed before Bynum’s administration founded TulStat, having a space to build off of the pilot’s success was critical in connecting more residents to much-needed services. The program has served 204 clients; in 2020, four Tulsans have “graduated” the program and have the needed support services in place for them to live safely in their homes.

In the future, CARES hopes to work with OPSI to expand their data capacity to learn how to predict who is at risk for becoming a repeat caller to the 911 system and intervening early to distribute tools and services. Aligning community resources to provide innovative, proactive care will not only save the city’s Medicare and Medicaid partners money, it could save a resident’s life.

Breaking the Cycle

Working with What Works Cities and the Behavioural Insights Team, OPSI also helped the Tulsa Municipal Court solve a problem that had burdened the court and vulnerable residents for years.

Previously, when the court issued a resident a fine in a criminal case, but that resident wasn’t able to pay that fine on time, the court would offer an extension in the form of a “Time to Pay Order.” Some found themselves with a fine due more than 12 months in the future — enough time for them to save money for the payment, but also plenty of time to forget when it was due. As of early 2018, more than 70 percent of those orders resulted in a failure-to-pay warrant. For many, a warrant can exacerbate the cycle of poverty: a driver’s license might be suspended and additional fines can accrue, pulling someone further into the criminal justice system.

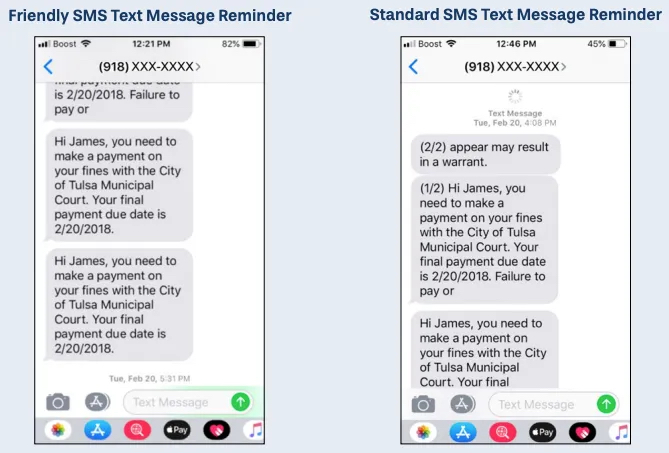
To combat the problem, OPSI partnered with the Court and Code for Tulsa to figure out how to reduce the number of warrants issued. Within a month, a text message pilot project was underway, designed around a simple hypothesis: Many people missed their Time to Pay Order deadline because they forgot the due date or lost paperwork. Together, OPSI, the Court, and Code for Tulsa developed a system to text simple, personalized reminders to a randomly selected pool of Time to Pay Order recipients. The test group received a text message reminder once a month leading up to their deadline.

Image Courtesy of the City of Tulsa.

The results were remarkable. During the six-month pilot, 63 percent of those who received a reminder paid all of their outstanding fees, compared to 48 percent of residents who did not receive reminders. Armed with data showing this 15 percent point increase, the Court system adopted the new reminder system. It now estimates an additional 320 people are paying their fees on time each year, avoiding warrants and additional problems because of the system. The Court benefited as well, seeing an annual $187,000 increase in revenue and a morale boost among employees who helped implement the solution.

“I’ve never been so excited about a job,” said Jamie King, a cost administrator at the court.

At the City’s Core

OPSI’s successful partnerships with city departments go beyond the fire department and courts. Three years in, OPSI has implemented practices and programs that have positioned Tulsa as a leader in data and innovation. In 2017, the office launched Urban Data Pioneers, an award-winning program consisting of teams of residents and city employees who analyze data to help the city solve key challenges and present policy recommendations.

With OPSI’s clear-cut ability to drive innovation, Mayor Bynum decided to integrate the office into the city’s key funding decisions. When Wagner became Director of Finance and CFO in early 2019, he brought OPSI with him to the Finance Department. This has changed the way Tulsa funds innovation. In essence, a data-driven approach has been institutionalized and scaled. Today, the city bases funding on data that proves programs work. OPSI vets data.

“We had the opportunity to take the approach and plug it into the finance department,” Mayor Bynum said. “It helps make it have much more of a citywide cultural impact.”

Join Our Certified Cities!

Tempe, Arizona, USA


Project Type:
Communications, Cross-Sector, Health & Wellness, High-Performing Government, Infrastructure

2023 Platinum Certification

  • Launched Vision Zero, a data-driven traffic safety initiative with a goal to achieve zerofatal and serious injury crashes. The Vision Zero task force is composed of over 50 stakeholders including city departments (police, transportation, fire) and community stakeholders (Arizona State University, school districts, public health agencies) that conducted an analysis of crash data for the years 2012 through 2017. Using that data, the task-force created 37 transportation safety strategies, including the creation of four safety corridors based on statistical analysis of a higher propensity for collisions, plans for new road infrastructure, and community outreach plans.
  • Uses a performance-led budget process based on metrics, and resident and business satisfaction surveys. For example, following an increase in emergency service calls in the Salt River Bottom, an area with significant natural hazards and a large homeless population, an Incident Management Team was launched. In 2023, the City achieved several of its goals, including 66% of people engaged accepting shelter services and 52 tons of debris and over 3,200 tons of vegetation were removed. Based on these initial results, new, recurring funding has been allocated to support the City’s high priority “community health & safety” metrics.

2020 and 2021 Gold Certification

“I am enormously proud that our city has achieved Bloomberg Philanthropies What Works Cities Platinum status. This award shows our community that we are leaders in using data to guide our community’s future and make informed decisions. We can show people that our city has saved time and money and has been able to benchmark progress to our goals because of our commitment to data.”

Corey Woods, Mayor

Compiled data from the city’s sewage system monthly to track community drug use patterns and understand the depth of opioid use.


Using this data, monitored areas with high opioid use and deployed emergency response resources and abuse prevention interventions to hotspots accordingly.


Utilized similar wastewater testing data and tracking methods to monitor COVID-19 levels and identify outbreaks.

The Desert City’s Approach to Data

Like so many other cities in the country, Tempe, Arizona has been deeply affected by the opioid abuse crisis. The desert city of nearly 200,000 is part of Maricopa County, Arizona’s most populous area. This county also has the highest number of opioid-related deaths in the state.

As this public health emergency became more devastating in Tempe and around the country, Tempe’s leaders realized they needed to step up in two ways. First, they needed to be transparent about the severity of the problem facing the community. Second, they needed to create innovative solutions to help stem the opioid epidemic.

In 2018, the Strategic Management and Diversity Office, in partnership with ASU’s Biodesign Institute, submitted a proposal to the Tempe City Council Innovation Fund. The proposal focused on using wastewater to track the presence of opioid metabolites at the community level. City leaders supported the idea with innovation funds and began a partnership with ASU to tap this unlikely resource for data and to better inform decisions. Today, Tempe is on the cutting-edge of opioid abuse prevention work in the United States and has expanded this partnership to gather data on the presence of COVID-19 in the community.

“Cities may not want to call attention to opioid overdoses or abuse in their community,” said Wydale Holmes, a strategic management analyst in the city’s Strategic Management & Diversity Office.

“In Tempe, we’re courageously saying, ‘Yes, we have that, but we’re also doing something about it.’

It turns out that sewage offers an abundance of public health-related data — including a community’s drug consumption patterns. Tempe leverages its wastewater to identify areas of the city with elevated levels of opioid compounds — and then deploys emergency response resources and abuse prevention interventions to hotspots accordingly. All of this aligns to one of Tempe’s performance measures: ending opioid-related abuse and misuse by 2025, as measured by the percentage of 911 calls likely related to the drugs.

“Tempe is committed to data-informed community solutions. This first of its kind city model using wastewater-based epidemiology data informs strategic policy and operational decisions to advance community health.”

Director of the Strategic Management and Diversity Office Rosa Inchausti

It’s great to have data, but if you’re not doing anything with it or connecting it to resources and strategies for change, then it’s just information.”

Strategic Management Analyst Wydale Holmes

A New Diagnostic Matrix

Testing wastewater for real-time information about key markers of public health — everything from viruses to food contaminants to drug compounds — has been around for decades. But the approach is relatively uncommon in the United States. And no other city is trying to map the needs of residents around the opioid abuse epidemic in this way, said Dr. Rolf Halden, a professor at ASU’s Biodesign Center for Environmental Health Engineering.

“The United States is behind Europe. Every community that has done this work has not abandoned it, which is a testament to how well it works and how successful it is,” said Dr. Halden, who leads the wastewater data collection project in partnership with the City of Tempe.

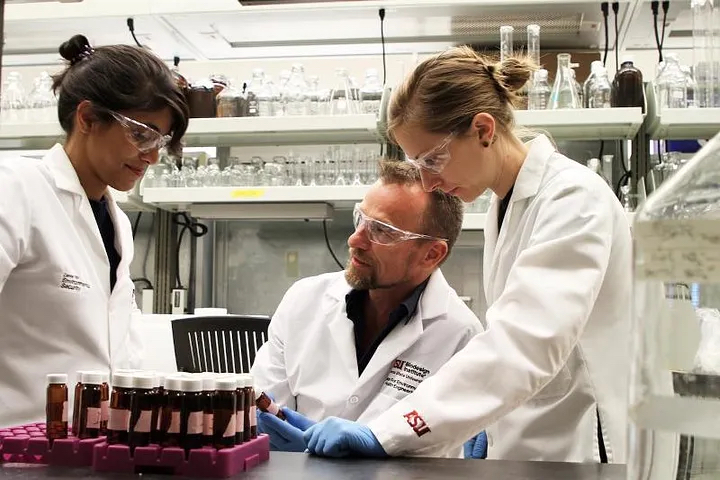
Dr. Rolf Halden and his team analyzing the wastewater samples.
Image courtesy of the City of Tempe.

Here’s how the wastewater analytics project helps the city identify opioid abuse hotspots and deploy resources strategically. Dr. Halden’s team takes raw sewage samples directly from five collection areas of the city for seven consecutive days each month. The scientists then test for four different types of opioids: fentanyl, heroin, oxycodone, and codeine.

After processing the samples, the ASU team hands off data to Tempe’s Enterprise GIS and Analytics team. The city can see where elevated levels of the four opioids are, and whether the opioids were metabolized or improperly disposed of. But the data contain no personally identifiable information — there is no way to tie data to specific addresses, neighborhoods or businesses.

Created by William Mancini for Fighting Opioid Misuse by Monitoring Community Health and provided courtesy of the City of Tempe.

All data are then published on the public Tempe Opioid Wastewater Collection Dashboard, created and maintained by Dr. Stephanie Deitrick, Tempe’s Enterprise GIS Manager. Through this dashboard and the Opioid Abuse Probable EMS Calls Dashboard, the information is analyzed by a multidisciplinary team, including Tempe’s Fire Medical and Rescue Department, to determine needed interventions. For example, if the data show a rise in opioid use among people under 18 in one area, the city might ramp up in-school outreach efforts. If one area suddenly becomes a major hotspot, the Tempe Fire Medical and Rescue Department can decide which emergency medical services and overdose prevention resources to move or increase to that area.

After implementing interventions, city officials can then track their potential effectiveness by monitoring changes in wastewater data alongside the EMS calls data. It’s a data feedback loop enabling the city to target its efforts — and, hopefully, prevent abuse and deaths.

“Dashboards allow people to quickly see overall trends within the data and to understand who is being impacted and where. Providing context is key when providing data to inform decision-making.”

Enterprise GIS Manager Dr. Stephanie Deitrick

Building a Data-Driven Culture

From its outset, the wastewater analytics project was directly tied to Tempe’s performance measure of ending opioid-related abuse and misuse. The Mayor, City Council, and City Manager set the expectation that reducing calls for opioid misuse or abuse was important to the executive leadership, and that both the goal and the performance measures supporting it needed to be shared internally with the City Council and administrative staff, community partners and externally to residents.

“Whatever we do, we always approach our employees and explain it to them and take the time to have the conversations about what we’re doing and why,” Tempe City Manager Andrew Ching said. “Every job has a purpose, and that job and that purpose exist within the framework of our strategic priorities and performance measures.”

City leaders also worked to communicate their efforts around the opioid abuse epidemic to the general public. The City of Tempe held an Opioid Town Hall in February 2019 to detail the wastewater project partnership and the types of support that Tempe provides to its residents struggling with opioids, their families and caregivers.

Anyone can visit the wastewater data dashboard and the Opioid Abuse Probable EMS Call Dashboard, designed and conceptualized by Dr. Deitrick and her team. The latter dashboard, which launched in 2018, gives Tempe Fire Medical and Rescue Department and the public a window into opioid abuse in the community. It details when calls related to abuse occurred, along with patients’ ages and genders, and the number of times Narcan/Naloxone overdose reversal medication was used during opioid-abuse related emergency calls.

Together, both dashboards inform Tempe officials’ efforts to end opioid misuse and abuse in the city, and help first responders and public health agencies on the ground see the impact of the targeted outreach and other interventions. It’s too early to tell how quickly the city will advance toward its goal — it was officially set in December 2019, when the baseline percentage of opioid-related EMS calls was 3.74 — but the right approach to data is in place to drive progress.

As the COVID-19 pandemic took hold around the world and in Tempe, city leaders have once again partnered with ASU wastewater researchers and are using this data in the same manner as the opioid data. The city is following the data to find areas of greatest need and is directing resources to help.

Join Our Certified Cities!

San Antonio, Texas, USA

Innovation & Problem Solving for the People in San Antonio.

Project Type:
Cross-Sector, Education, Finance, High-Performing Government, Infrastructure

2023 Gold Certification

Concerned about an uptick in the number of older homes being demolished, the City of San Antonio and community stakeholders gathered data on the impacts of demolition and possible alternatives. They found that over the past decade, $16 million worth of salvageable building materials and 170,000 tons of waste had been sent to landfills through the demolition of homes built prior to 1960. Demolitions were also releasing airborne toxic pollutants into neighborhoods with larger numbers of Hispanic households and households with lower incomes. In 2022, the City Council adopted a deconstruction ordinance to advance the City’s health and equity goals, create jobs and preserve affordable housing.

2021 Silver Certification


Trained city staff in data analytics to develop better cross-departmental solutions that focus on improving resident outcomes.


Launched an app to streamline students’ digital access to public libraries and school library resources.


Created a Budget Equity tool that considers racial and economic equity in the budget-making process by using data and evidence to ensure services reach areas of need.

The Beginning of Data

One-hundred years ago, a hurricane hit Texas and caused severe flooding in San Antonio. To prevent future floods, architect Robert H. H. Hugman proposed connecting different portions of the City’s central storm sewer system into a loop connecting to the San Antonio River, setting the stage for pedestrian promenades, boat tours, and new businesses. It took a few decades to build, but the Riverwalk is now an iconic part of the City visited by about nine million tourists a year. It stands as a prime example of San Antonio’s tradition of problem solving that continues to drive the City forward in the 21st century.

Today, that tradition is alive and well in the City’s Office of Innovation. It was founded amidst the financial crisis of 2008, tasked with finding ways to do more with less. Over the last 10 years, however, the focus of the office has expanded beyond identifying process improvements and efficiencies. In recent years its staff has begun working with departments across the City to build a data-oriented culture, with a focus on foundational practices including performance & analytics, evaluations, and general management.

The City of San Antonio, Dillard says, is a highly collaborative place where silos are being dismantled in favor of creative partnerships that tap into and cultivate talent. A notable example of this: the City’s Innovation Academy, which is a joint project of the Office of Innovation, the City’s HR department, and Alamo Community Colleges (ACC). Launched in 2020, the Academy trains creative problem-solvers across city departments who have leadership potential and a proposed innovation project toward which they want to apply new skills.

ACC offers city staff intensive courses customized to meet the needs of the City in three specific areas: process redesign, human-centered design, and data analytics. The Academy runs two cohorts a year; participants attend 14 full-day sessions spanning 10 weeks and collaborate on projects. The Innovation Academy’s current cohort comprises senior leaders from across departments and members of the IT department. The idea is that mixing staff from different parts of government helps break down silos, and Academy graduates will pass on their knowledge to colleagues and the staff they manage.

“The structure of Innovation Academy operates like a virtuous cycle, with each cohort helping to build the ecosystem for innovation. It’s a force multiplier.”

Senior Innovation Specialist

Data plays a foundational role in the Academy — and increasingly, in the City itself. “We believe that if you can’t measure it, you can’t manage it. This idea is core to the academy and it’s helping us report on the value of graduates’ projects,” Reat says. Those projects are already having a positive impact on the lives of residents across San Antonio.

“We know that in so many ways, the future of city governance lies in data-driven innovation. I like to think of the Office of Innovation as the engine moving us forward.”

Chief Innovation Officer Brian Dillard

Big Life for Digital Readership

A project backed by the San Antonio Public Library (SAPL) last year offers a prime example. Academy graduate David Cooksey, formerly SAPL’s performance and innovation manager, recognized that digital readership among local schools could be improved if students had a more streamlined way of accessing public libraries and school library resources.

Using techniques learned last year in academy courses, Cooksey worked with OverDrive, a digital distributor of ebooks and audiobooks, to launch an app called Sora. It gathers more than 250,000 digital reading resources offered by city schools and SAPL into one place — no library card required. The initiative helped exponentially increase digital readership among San Antonio school children during the COVID-19 pandemic. About 1,300 digital books were read by children per month in fall 2019, before Sora; 18,000 books were read per month in fall 2020.

After a successful pilot in San Antonio — where Sora is now used by nearly all 17 public school districts — OverDrive began partnering with other city governments to offer Sora through libraries and schools across the country.

An R&D League cross-sector team work session. Image courtesy of the City of San Antonio.

Along with the Academy, the Office of Innovation operates the R&D League, which creates cross-sector teams to evaluate new ideas using the scientific method. The basic idea is to make sure proposed policies and programs are evidence-based before being implemented citywide. “The R&D League really explores the frontier of innovation and evaluation,” says Kate Kinnison, R&D administrator in the Office of Innovation. “I like to think of us as scientists who run experiments.”

In fact, the League does source scientists from partner organizations. Experts from Southwest Research Institute, NASA’s biggest contractor; the University of Texas at San Antonio, the largest research university in the City; and USAA, a San Antonio-based Fortune 500 financial services company, all provide experts to help city departments realize their visions.

Since launching last year, the League has developed four “experiments,” each of which states a hypothesis and research questions. One project is equipping city waste management vehicles with sensors to identify and collect reliable data on infrastructure needs such as potholes.

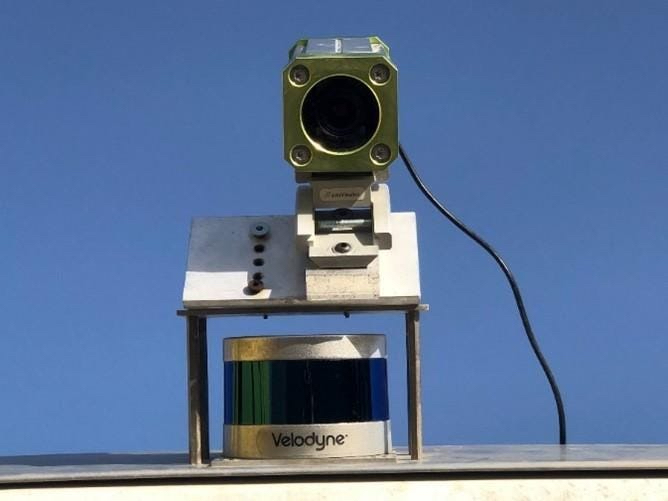
A data-collecting sensor installed on the roof of a City waste management vehicle. Image courtesy of the City of San Antonio.

Another effort involves three randomized control trials supported by The Behavioral Insights Team (BIT), a What Works Cities expert partner. The aim is to better understand how residents prefer to receive information from the City and how they engage with it, so departments can better coordinate and deliver services. Results from two trials will inform strategies for engaging and communicating with residents; the third trial involves a survey aiming to surface resident needs so the City can better support communities.

“Ultimately, we hope to leverage experiment results to more effectively provide the services residents want. It’s all about responsive, evidence-based policymaking — that’s the goal.”

Research & Development Specialist Rhia Pape

Join Our Certified Cities!

Salinas, California, USA

Salinas Data-Driven Youth Violence Prevention Strategy.

Project Type:
Community Engagement, Communications, Cross-Sector, Health and Wellness, Public Safety. Youth Development

WWC - Silver Certification Badge for year 2021

At a Glance


Implemented a strategic, data-driven plan that directed increased funding to a street outreach program that decreased the youth assault victim rate from 22% in 2007 to less than 10% in 2019. That success came from implementing a comprehensive approach to violence reduction.


Conducted a three-year data-driven effort that helped provide a clearer picture of how the city’s police department could better match calls for service with staffing and police officer beats.


Used online capacity assessments to help City staff concentrate outreach efforts efficiently and boost the effectiveness of external partnerships.

Making Safe Choices

In 2010, the Obama administration kicked off a pilot program to address violence in some of America’s toughest places. On the shortlist, alongside large urban centers like Chicago, Detroit, and Boston, was the midsize Central California city of Salinas.

The problems Salinas faced were not well known on the national stage, but residents were all too familiar with the gang violence plaguing their city. In just the first three months of the year prior, Salinas had seen a dozen homicides — and victims of violence were largely people under the age of 25. The inclusion of Salinas in the federal pilot highlighted both the severity of the problem and the potential to solve it.

“The others were bigger cities with bigger problems, but our crime rate was just as high,” says Jose Arreola, community safety administrator for the City of Salinas and director of the Community Alliance for Safety and Peace (CASP). Led by the City’s community safety division, CASP launched in 2008 to convene public and private stakeholders around the problem of youth violence. The program caught the eye of Justice Department officials who saw its potential.

As a result of the federal support, CASP was able to implement a strategic, data-driven plan that resulted in the rate of youth assault victims dropping from 22% in 2007 to less than 10% in 2019. That success came from implementing a comprehensive approach to violence reduction that involved increased funding to a street outreach program based on an assessment of gaps in current services provided by the City and nonprofits. The youth victim rate continued to drop in 2020, but increased slightly in 2021. Arreola attributes the increase to disruption of in-person services during the COVID-19 pandemic, which closed schools and paused street outreach efforts.

The successful violence prevention strategy is a major example of how Salinas’ commitment to foundational data-driven practices — especially performance & analytics and evaluations — has translated into meaningful results.

“The data has shown us that we’re moving in the right direction in terms of strategy and tactics.”

Community Safety Administrator Jose Arreola

‘Relationships Are Key’

What worked in Salinas is two-fold. Externally, CASP deploys a street outreach team that takes time to build trust and relationships with gang-affiliated youth. The aim is to reach individuals who are at risk before they become a victim of violence. Internally, the program convenes agencies and nonprofits and engages with them regularly, so that CASP staff can fast-track youth to the right types of services.

Four years ago, high school administrators identified the need to have on-site mental health services for students. Through CASP, the school district was able to connect with the City’s behavioral health department to place counselors at each school. They are still there today, a testament to the lasting effects of the program’s connections.

“The whole strategy of CASP is that relationships are key,” Arreola says.

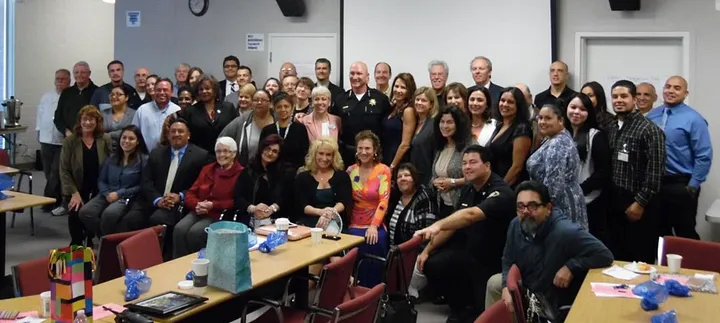
CASP staff and partners at a 2016 meeting. Image courtesy of the City of Salinas.

His team relies on data to track the program’s progress. They work in partnership with the Monterey County Health Department to process data (from the police department and other agencies) and determine what is statistically significant. Homicide data, for example, is not useful in determining what drives violence, since it tends to be erratic. Heat maps that identify areas where violent assaults happen have been more helpful in guiding where the program directs its efforts, and in showing that it works. Arreola says his team is particularly proud of how the maps show hotspots diminishing over time.

“That represented thousands of youth not victimized by violence and thousands of families not living in fear,” he said.

CASP also uses data in the form of capacity assessments to gauge the engagement levels of existing partners, which helps City staff concentrate outreach efforts efficiently and boost the effectiveness of CASP’s external partners. Assessments have also helped identify new partners. For example, mindful that hospital-based violence intervention programs have proven to be valuable parts of other cities’ comprehensive strategies, the City launched a pilot out of the Natividad Medical Center’s Level II Trauma Center. The program, which offers trauma-informed care to violently injured patients, is now permanent.

Another reason CASP has been so effective is that it bridges a common gap among cities with gang violence: It’s not easy to connect young people who have dropped out of school with services. They often do not get any help until they make contact with the justice system after being arrested.

Having the data to show that CASP works helps sustain the effort. The initiative is now supported by a variety of funders including foundations and government grants.

“Funding for something like this can be a tough sell. Ideologically, a lot of people believe kids involved in this lifestyle are making a negative choice and don’t deserve help. That’s a hard narrative to push back against.”

Community Safety Administrator Jose Arreola

An Evolving Police Department

The progress Salinas has made in reducing gang and youth violence has coincided with a period of transformation within the City’s police department. One goal was to make the department’s officer corps look more like the people they interact with.

As the city’s population shifted from 47% Hispanic in 2016 to 73% Hispanic in 2021, the police department shifted its hiring practices to prioritize adding Spanish-speaking staff. Over that period, it has hired an additional 26 officers who are Hispanic, for a total of 73. The department also more than doubled the number of female officers over that period.

A Salinas police officer at work. Image courtesy of the City of Salinas.

“We can truly say that we are the community and the community is the police department,” Police Chief Roberto Filice says.

The department also embarked on an efficiency study in 2017, a three-year data-driven effort that helped provide a clearer picture of how it can better match calls for service with staffing and police officer beats. As a result, it may implement a new beat system for the first time in three decades to spread the workload more evenly across staff.

The department also piloted a fourth shift this year that helped align staffing with times of day when calls for service are more frequent. The fourth shift, which overlapped with existing morning and afternoon shifts, helped the department maintain its response time — four minutes and 28 seconds — even as it saw an increase in calls and operated with an overall reduced staff. In the last four years, 15 positions have been cut from the force due to budget reductions: the equivalent of an entire shift.

Chief Filice says he won’t be able to continue the fourth shift or make the beat changes immediately due to the staffing shortage, but he is confident that the numbers demonstrate the value in innovating and realigning the department to fit the community’s evolving needs.

“I am a data-driven person. I love using technology to make us more efficient.”

Salinas Police Chief Roberto Filice

Join Our Certified Cities!

Disclaimer