Burlington, Vermont, USA
A Data-Driven Approach to Building More Housing
Project Type:
Community Engagement, Economic Development, Housing

At a Glance
Passed data-driven zoning changes that are boosting the amount of housing that can be built in neighborhoods across the city.
Used disaggregated data and community outreach to design a small business loan program that complies with Sharia law, allowing Muslim residents to more easily start businesses.
Novel approaches to opioid response have grown out of regular CommunityStat meetings where elected leaders, community members and subject-matter experts review overdose data and collaborate on responses.
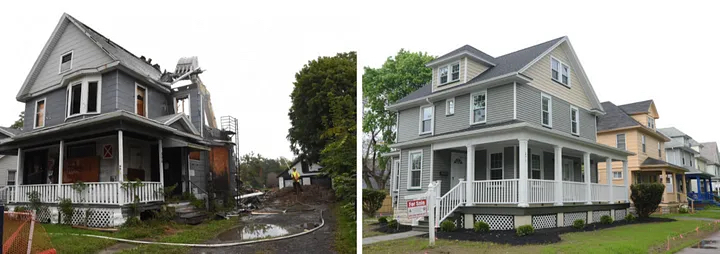
In Burlington, a city of 45,000 on the shore of Lake Champlain, one of the biggest challenges today is the same problem that cities 10 and 20 times its size are wrestling with: How can we build enough housing to bring down the skyrocketing cost of living?
To answer this question, Burlington looked at one common obstacle for housing supply: zoning laws. City leaders started by assembling data to understand the existing state of the local homeowner and rental markets, and how those have changed over time. The resulting Housing Report set the stage for extensive resident engagement (including housing trivia) and public debate around housing needs. It also showed clearly that the city would not meet its goal of building 1,250 new housing units over five years without trying new approaches.
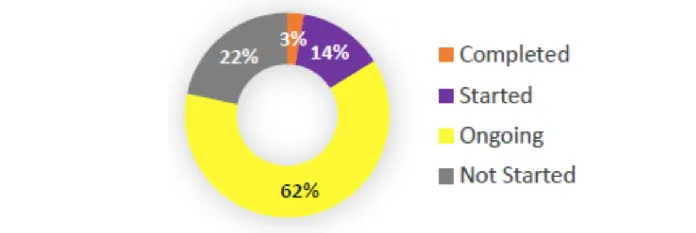
1,124 number of units built or in construction and permitting pipeline as of June 2024
“We’ve used data to inform this [zoning amendment] process, and we’re tracking and evaluating the work that we’ve done.”
Another analysis produced data on the character and typologies of different neighborhoods in the city and what zoning does and does not control. Both datasets informed the text of the final zoning amendment approved by the City Council, which aimed to be sensitive to the existing context of residential neighborhoods while offering the flexibility necessary to encourage construction of more housing types.
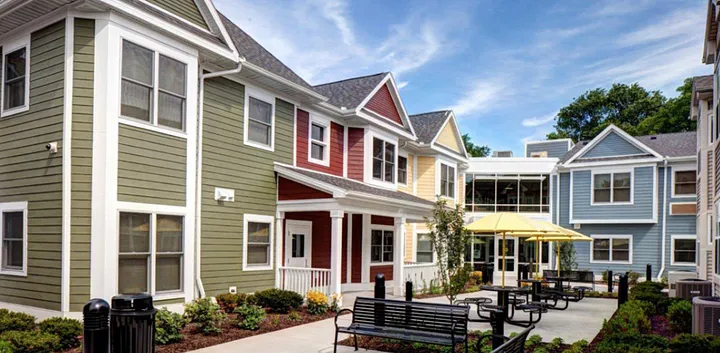
The end result is the city’s new Neighborhood Code, launched in 2024. The plan changes zoning in every neighborhood in the city to allow more multi-family dwellings to be built. This upzoning solution aims to solve the problem of “missing middle housing”, which are multi-unit properties such as townhomes, duplexes, triplexes and cottage clusters, that fill the gap between single-family homes and large apartment buildings. It offers residents more options based on their budget and increases Burlington’s housing supply. Where similar proposals in other cities around the country have proven controversial, Burlington’s City Council passed the plan unanimously.
40 number of units permitted in the first eight months of the new Neighborhood Code.
There are early signs that the code changes are making a difference. Since March 2024, 40 new housing units were permitted under the new code – well more than the 10 per year city planners expected. That alone won’t fix Burlington’s housing supply problems. But over time, the Neighborhood Code stands to play an important role in how the city meets its housing goals, which are tracked real time on a public-facing Housing Dashboard. “There is evidence in other cities that real increases in housing supply have led to lower rents,” says Nancy Stetson, Senior Policy and Data Analyst. “We want to be able to show that in Burlington, too.”
“Being a What Works Cities Certified city affirms the direction we’re on as a city that’s going to innovate around problems we face and also let the vibrancy of Burlington reemerge.”