Calgary, Canada

Make it Personal: How Calgary Is Supporting Residents to Take Climate Action.

Project Type:
Energy, Environment, Infrastructure and Utilities, Technology

At a Glance


The residential solar calculator helps Calgarians understand the potential for solar energy generation in their home. It provides an estimate of energy cost savings, greenhouse gas reductions and the investment payback period. This data supports Calgarians to make informed decisions on energy use in their home.


Applied advanced analytics to map data, 3D building models and energy costs to create a residential solar calculator tailored for Calgary households—an in-house solution that contributed to a doubling of the city’s residential solar installations in 2023.


48,000 visits to the online residential solar calculator, with 65% returning users, which shows high engagement from residents.

The importance of harnessing the power of the sun is clear. Worldwide, extreme weather events have increased fivefold since 1970 and 2024 was Canada’s costliest year on record for weather-related disasters. Calgary, Canada’s sunniest city, enjoying approximately 333 days of sun each year, and Canada’s fastest-growing metropolitan area with 1.68 million residents, recognizes that addressing climate change requires collective action. For individuals, it can be hard to know how to contribute. But The City of Calgary is empowering residents to act with a climate strategy that blends data, innovation and community engagement.

One standout initiative is Calgary’s Residential Solar Calculator. Launched in 2022, the online tool allows homeowners to assess their property’s solar potential. It uses LiDAR remote sensing and GIS mapping technology to account for roof tilt, orientation and shading and provides personalized solar insights for each Calgary residential address. The tool equips residents with vital knowledge to weigh the pros and cons of solar energy and engage with service providers confidently. The calculator educates homeowners on switching to solar energy, providing an estimated upfront cost and monthly energy savings. This information is crucial for determining whether solar energy is financially viable and how quickly the investment will pay off.

Calgary’s Residential Solar Calculator dashboard.

“Data analysis, visualization and data-supported stories play an incredibly important role in our climate work today and the climate work of tomorrow. We are using data to help us understand the complex nature of climate systems, identify patterns and trends, inform action and communicate with Calgarians.”

Dawn Smith, Manager, Governance & Reporting, Climate & Environment

To support Calgary’s broader greenhouse gas reduction goals, The City wants to generate more of its electricity needs within city boundaries from renewable sources. In 2023 alone, Calgary installed 16,000 kilowatts of residential solar PV—doubling the city’s capacity. During this time, more than 48,000 people have visited the calculator and almost two-thirds are return users, signaling high engagement. The popularity of the calculator highlights that there is an appetite from Calgarians to explore and understand the benefits of installing solar energy in their homes. By providing easily accessible, relevant and tailored information to homeowners, the residential solar calculator helps drive solar adoption indirectly through education and information sharing.

Supporting these efforts is Calgary’s comprehensive climate and environment dashboard, which tracks metrics and shares key program information with residents. This dashboard will ensure The City is transparent and accountable to its climate goals and outcomes by providing a comprehensive resource for the community to monitor results.

“Calgary is committed to embedding data and evidence into our decision-making processes. This approach ensures that taxpayer dollars are used effectively and that Calgary is a stronger and more resilient city, capable of facing future challenges.”

Mayor Jyoti Gondek

Climate change is a global challenge, but Calgary’s approach shows the power of solutions that involve government and residents. By making climate information more personalized and accessible to all, Calgary is not only addressing the crisis—it’s demonstrating its commitment to support its residents and setting a benchmark for other cities.

Calgary’s Climate and Environment dashboard.

Join Our Certified Cities!

Fort Lauderdale, FL, USA

Fast-Tracking Climate Resiliency

Project Type:
Community Engagement, Environment, Infrastructure and Utilities

At a Glance


25.6” – Amount of rainfall recorded in Fort Lauderdale on April 12th, 2023, a new one-day record for the city.


$500 million – Cost of stormwater infrastructure improvements planned across 25 Fort Lauderdale neighborhoods over the next 10 years.

On April 12th, 2023, Fort Lauderdale was unexpectedly inundated by a 1-in-1,000 year storm. More than two feet of rain fell in just 12 hours, the most ever recorded there in a single day. Stormwater infrastructure was designed to handle a maximum of three inches of rain in 24 hours and was quickly overwhelmed, flooding wide swaths of the city of about 189,000 on Florida’s southeastern coast. More than 1,000 homes and City Hall were severely damaged, with water chest-deep in some places.

The unprecedented precipitation coupled with a very high tide underscored how climate change makes storms both more intense and less predictable. For Mayor Dean Trantalis and his leadership team, it also made clear the City needed to make Fort Lauderdale’s stormwater infrastructure stronger—and they needed to do it now.

A flooded street in Fort Lauderdale where climate change is creating more intense and unpredictable storms. Image Courtesy of the City of Arlington.

“We use data to think about everything. It’s all data-driven, from flood mapping and risk modeling to infrastructure planning and asset management. And now we’re really starting to tackle the challenge of figuring out what’s going to flood, when and where.”

Dr. Nancy Gassman, Deputy Director of Public Works

“Prioritizing the right climate adaptation projects requires careful location-specific risk assessments. I’m proud of our enhanced infrastructure strategy, and I’m proud that Fort Lauderdale is being recognized through What Works Cities Certification for putting data at the center of our climate resilience work.”

Fort Lauderdale Mayor Dean Trantalis

In November 2023 at the State of the City address, the mayor unveiled Fortify Lauderdale, a $500 million initiative to speed up and expand flood-prevention infrastructure projects across the city through 2034. The City had already been planning to upgrade infrastructure in eight neighborhoods before the April 2023 flooding. After the disaster, leaders ramped up data gathering efforts to identify high-risk areas and refine stormwater infrastructure plans for another 17 neighborhoods.

During Phase 1of the Stormwater Master Planning effort, city employees and consultants attended neighborhood association meetings asking residents to mark up a map detailing exactly where flooding occurred. They also gathered flooding data from residents who called the city’s customer service hotline. Internally, the City conducted a comprehensive stormwater asset management inventory, leaning on its GIS team to detail not just the location of every drain and pipe but also all maintenance work done on each piece of infrastructure in recent years.

All of this data informed the citywide stormwater master planning effort, which allowed leaders to prioritize infrastructure projects based on specific needs and risk levels. The result: 25 additional neighborhoods will see flood prevention upgrades over the next decade, more than triple the number that had been set to receive improvements prior to 2023.

“We have to manage through data given the organization’s finite resources. The ability to segment and analyze data in targeted ways is crucial for navigating where resources should go.”

Susan Grant, Acting City Manager, Fort Lauderdale

As of August 2024, about half of Phase 1 of the Stormwater Master Plan neighborhoods were complete or in construction. Spanning eight neighborhoods, the plan provides 50 miles of new stormwater pipe, 10 new stormwater pump stations, higher seawalls and enhanced swales, among other improvements. These will help get water out of neighborhoods faster, preventing costly damage. The new stormwater improvements are expected to improve the drainage capacity from 3 inches of rain in 24 hours to 7-10 inches. Fortify Lauderdale also includes developing guidelines that will strengthen outreach to owners of vulnerable properties to help them improve their own climate resilience practices. Together, these efforts are showing residents that when the next storm comes, the City can reduce the intensity, duration and frequency of flooding to roads passable, protect homes and prevent life-changing damage.

“A successful infrastructure resilience strategy needs to be anchored in community engagement and solid data,” Mayor Trantalis says. “We’re determined to maximize the value of every dollar we spend on these projects—there’s no time to waste.”

Join Our Certified Cities!

Raleigh, North Carolina, USA

1,000 Trees Rooted in Data, Community and Sustainability.

Project Type:
Community Engagement, Environment, Health and Wellbeing, Infrastructure and Utilities, Technology

At a Glance


The City assessed tree distribution citywide to plant 700 new trees in areas that needed the most shade. 


Raleigh’s Digital Inclusion education program has trained more than 3,800 residents, provided more than 1,000 computers to residents, and delivered more than 10,000 volunteer hours.


A biannual community survey gathers input from residents on issues that impact quality of life, which guides services and policies.


A cost-share program reduces water pollution and has helped fund more than 200 stormwater infrastructure projects (such as green roofs, cisterns, and rain gardens) on private property. Up to 100% of costs are covered for non-profits and lower income property owners.

For over 200 years, Raleigh has been known as the “City of Oaks” for its towering oak trees that line streets and shade neighborhoods. Yet today, the city, which has long celebrated its natural canopy, confronts a stark reality: More than a quarter of people in the Raleigh metro area live in neighborhoods that become heat islands in the summer, where temperatures soar above the city’s average.

Those extra degrees have a high cost — heat islands make neighborhoods less livable and increase the risk of heat-related health complications. These heat islands are disproportionately located in low-income neighborhoods. One reason for the heat islands is a lack of trees, which results in heat being absorbed in materials like concrete and asphalt. This heat is then slowly released causing temperatures to stay high even after the sun sets, making it difficult for neighborhoods to cool down overnight. This prolonged heat exposure can exacerbate the effects of heat stress and lead to higher energy costs and poorer air quality.

Image courtesy of the City of Raleigh.

Today, the “City of Oaks” is working to combat heat islands through a data-backed street tree planting project.

At the start, the project wanted to learn how trees were distributed across the city. Then, the team wondered if planting more trees in certain locations could reduce the number of heat islands

The City analyzed U.S. Census data and an Urban Heat Island study. Then it conducted a walking survey of Raleigh’s current street trees. City staff mapped tree density and income levels, which showed that lower income neighborhoods had fewer trees than their wealthier counterparts. On average, there is one street tree every 1,000 feet in the chosen priority area, whereas other, newer parts of the city have street trees every 40 feet.

“Strong data practices have made us a better organization. We’re able to better connect with the community because there are decisions that are made based on what the data tells us. That data gives us a solid foundation to drive policy and resources.”

City Manager Marchell Adams-David

“I am proud but not surprised that Raleigh continues to achieve recognition for effectively using data and science to drive outcomes. I am also proud of our staff and their devotion to developing the data and using it to implement the solutions that improve the lives of our residents. This designation from Bloomberg Philanthropies is a result of their hard work.”

Raleigh Mayor Janet Cowell
Image courtesy of the City of Raleigh.

The City’s solution is to plant 1,000 street trees by the end of 2025, not located randomly across the city, but in the neighborhoods that need it most to reduce urban heat islands. Urban trees and nature can cool cities by up to 14 degrees Fahrenheit, which makes heat-related illness less likely and reduces energy consumption, saving residents money. So far, 700 trees have been planted in low-income neighborhoods in southeast Raleigh, helping make the air cleaner, preventing flash floods during storms, absorbing carbon dioxide, and encouraging communities to gather and play outdoors.

Raleigh city staff know their numbers, but they aren’t missing the forest for the trees—community support and resident engagement are critical for long-term success. The project has connected with residents at community events for Earth Day and Arbor Day. Additionally, residents near potential tree planting spots receive paid-postage mailers from the City that allow them to select the tree species they want or say that they would not prefer a tree.

The Street Tree Project is just one piece of Raleigh’s climate efforts, and it represents more than a tree planting initiative — it’s a data-based strategy to ensure that all residents, no matter where they live, can share in the benefits of the City of Oaks.

Image courtesy of the City of Raleigh.

Join Our Certified Cities!

San Fernando, Chile

After the Flood, a Disaster Relief Upgrade

Project Type:
Environment, Health and Utilities, Infrastructure, Public Safety, Technology

At a Glance


100% of the municipal administrative process for climate emergency relief was digitized after the destructive floods of June 2023.


The average response time of the municipality to provide food and other assistance to flood victims in 2024 decreased from six to two days.


Introduced an emergency phone line that was able to receive a daily peak of 150 to 200 calls during winter emergencies, a significantly higher volume than its average of six calls per day.


Used data science to segment the population within the network of three primary health centers, which will reduce overcrowding in one of the centers by 79%.

In June 2023, disaster struck San Fernando. Residents of the provincial capital city, which sits along the Tinguiririca River in central Chile, watched as floodwaters rose following the heaviest rainfall to hit the region in decades. Nearly 600 families living in vulnerable neighborhoods were affected. Some lost everything.

To receive emergency aid, flood victims had to register with the government through a laborious process. The main communication channel connecting residents was the telephone—but the City could only handle eight calls at one time. Government officials met with affected residents, taking notes on paper to record individuals’ needs and locations. Sometimes documents would get wet and damaged, requiring additional work and slowing aid delivery. The analog process was time-consuming. Relief supplies, such as food and clothing, didn’t reach those in need for six days, on average.

Image courtesy of the City of San Fernando.

Following the disaster, the Municipality decided to create a Directorate for Disaster Risks, which leads and coordinates responses to climatic emergencies. (The Municipality also built a new retaining wall to mitigate future flood risks.) Leaders of this new office quickly made the decision to bring disaster relief administration into the 21st century, in support of San Fernando’s inaugural data governance strategy. Spanning 2024-25, it aims to improve data-driven decision-making, efficiency and performance management.

The Directorate analyzed and then digitized each part of the emergency aid registration process. Its team then implemented a cloud-based platform to capture data from in-person visits, including from a new GIS tool detailing exact locations of individuals in need. New digital infrastructure also sped up aid delivery reporting processes and allowed local officials to gain a more current understanding of disaster relief operations.

It didn’t take long for digitization to deliver value to residents. In 2024, the Tinguiririca River flooded again. There were fewer flood victims, thanks to improved physical barriers as well as flood awareness communications from the Directorate. The residents who did require aid saw help arrive within just two days, on average, thanks to faster relief registration and aid delivery processes.

Image courtesy of the City of San Fernando.

This is just one example of the benefits San Fernando is seeing as it upgrades its digital infrastructure, says Mayor Pablo Silva Perez. He created the City’s Continuous Improvement and Data Science departments after his election in 2021. “Better data infrastructure sets the stage for improving our operations and decision-making. We see how it improves our city, and we’re just getting started.”

“In an era of tight budgets, data-driven decision-making allows government to optimize the use of resources and maximize benefits to residents. The What Works Cities certification process is so valuable because it supports all this, and much more.”

Mayor Pablo Silva Perez
San Fernando Mayor Pablo Silva Perez meets with the What Works Cities Certification team.

“Data is an extraordinary tool for improving cities. If I could say one thing to leaders of cities around the world, it is: Don’t doubt the value of data and don’t hesitate to begin and then continue the work of creating a new governing normal.

Mayor Pablo Silva Perez

Join Our Certified Cities!

Vicente López, Argentina

Using AI to Detect Dengue-Carrying Mosquitoes in Real-Time

Project Type:
Environment, Health and Wellbeing, Technology

At a Glance


Vicente López developed a device powered by AI to instantly detect dengue-carrying mosquitoes with 90% accuracy, helping the City’s response time go from ten days to real-time.


The City’s data-driven recycling strategy implements weekly collections, new trash receptacles and environmental awareness campaigns. The goal is to reduce the amount of trash sent to landfill by 25%.


The 1000 Days Program aims to improve the comprehensive health of pregnant women, expectant mothers and children from 0 to 3 years old, especially those in vulnerable communities.


Vicente López is one of the first Latin American cities to publish a proclamation for the ethical use of artificial intelligence, helping the City stay updated and promote good practices in the use of Generative AI.

The City of Vicente López, Argentina, has a new tool in the fight against dengue. With artificial intelligence that can detect the presence of dengue-carrying mosquito species in real time.

The device is one of many data-based initiatives being developed in municipal government and has the potential to save lives in South America and around the world.  As temperatures rise, dengue spreads to cities where it was not a significant problem before.

This is the case in Argentina, where the number of dengue cases shattered the country’s previous recorded records in 2023 and again in 2024. People who are bitten by a mosquito carrying the dengue virus often experience high fever and severe headaches and joint pain. In severe cases, dengue is deadly.

One of the City of Vicente López’s AI-powered mosquito traps.

“The use of data helps us improve our management and provide quality public services. It is not only about improving our processes, but also about having a positive impact on the daily lives of our neighbors.”

Vicente López Mayor Soledad Martínez

35 mosquito traps equipped with artificial intelligence were placed throughout the city, with 35 more planned to be installed by 2025.

As part of its efforts to combat this disease, the municipal government has placed dozens of special AI-powered mosquito traps near health centers, schools, sports fields and other places in the municipality. The traps are approximately the size of a 500ml bottle and they use a fan, along with an attractant, to attract mosquitoes through a hole. Once inside, a camera takes a photo of the insect and sends the image to a database, hosted in the Amazon Web Services cloud, containing thousands of mosquito photographs.

That’s where artificial intelligence comes into play. AI classifies photographs to determine if the mosquito in the trap is the Aedes A species aegypti that transmits dengue, with an accuracy greater than 90 percent. This data is sent to the municipal health inspectors, who closely observe the flow of information. “When the alert arrives, a prevention protocol is activated and immediate fumigation,” said Juan Pablo Fittipaldi, Secretary of Digital Transformation of the Municipality.

It is too early to know if this innovation is having a real effect on dengue cases. However, what is clear is that Vicente López’s high-tech, data-driven approach has accelerated the speed with which they respond to the problem. The city’s previous detection systems relied on manual collection and analysis of samples that took up to ten days to detect the presence of dengue in the municipality. The new traps reduce that detection time to approximately one hour.

2 weeks to 1 hour The time to detect and respond to mosquitoes carrying the dengue virus was reduced from two weeks to one hour.

Vicente López City staff meet with What Works Cities Certification team.

The idea for this solution dates back to 2017, when two residents, the Barceló brothers, attended a hackathon at the Vicente López University Center that was aimed at using city data to find new ways to solve problems. They came up with the idea of the trap, which has gone through several iterations since then. The municipality is eager to share the solution with other cities where dengue is a threat to residents. Today, parts of the software code that feed the solution are freely available for anyone to use.

Through its innovative artificial intelligence traps and robust data management, Vicente López proactively confronts the growing threat of dengue and lays the foundation for a healthier community.

“What Works Cities Certification is not just about receiving an award, it is a process. It is about continuing to improve our management and being part of a network of cities that work with data to improve the lives of neighbors.”

Vicente López Mayor Soledad Martinez

Join Our Certified Cities!

Boise, Idaho, USA

Recycling Wastewater to Build a More Resilient Future

Project Type:
Communications, Community Engagement, Infrastructure and Utilities

At a Glance


$570 million: Bond amount voters approved with 81% support in November 2021, funding Department of Public Works Water Renewal Services projects slated through 2030. 


50+: Number of open house events held at the city’s water recycling pilot site


6 million gallons: Amount of additional water Boise will add to its renewal capacity each day when fully its Recycled Water Program is implemented, strengthening the city’s resilience against drought, population growth and climate change.


2029: Year the brand-new water recycling facility is slated to open.

In Boise, climate change and population growth all pose a long-term challenge to the most precious natural resource: water. The city of about 247,000 people draws 70% of its water from aquifers and 30% from the Boise River. Both water sources are under growing stress due to rising demand for irrigation, shrinking snowpack and increasing drought frequency.

To build resilience and support growth, the City of Boise has embraced water recycling. In 2020, the Department of Public Works’ Water Renewal Service utility issued a data-driven strategic plan to ramp up Boise’s water recycling capabilities over the next 10 years, with a new focus on aquifer recharging. A centerpiece of the plan is construction of the city’s first recycled water facility.  

City leaders have worked to rally Boise residents around their vision to ensure an adequate supply of water for both residential use and new businesses. They built buy-in various ways. The City held over 50 community meetings to show trade-offs of water treatment models to address limited water supply. The result was a $570 million bond measure that passed in 2021 with voters’ overwhelming support (81% voted in favor). This allowed the City to move on major water renewal capital projects, including a new $420 million water recycling facility, with minimal sewer user fee increases.

Leaders also leveraged the annual budgeting process to build stakeholder support. In recent years the City’s budget has included tens of millions of dollars in water renewal capital project investments, including for an advanced water treatment pilot to test new technologies. The pilot site, which opened in 2023, tests five different filtration technologies including reverse osmosis and ultraviolet advanced oxidation, to remove all chemicals and pollutants from industrial wastewater. Notably, one goal for data from the pilot is to build trust with residents.  The City aims to show that the recycling treatment will produce safe water for the community. 

As Boise city officials and residents deepen their knowledge of innovative filtration technologies, which aren’t common in Idaho, a more resilient future is coming into view. In February 2024, the City purchased a 76-acre plot of land where it will build the new state-of-the-art recycled water facility. Construction will start in 2025, a key step toward a more sustainable Boise.

The WWC team at the Boise water facility.

“The open houses we’ve done with community engagement of this pilot, the ability to show people the technology and talk about it, is really incredible.”

Haley Falconer, Environmental Division Senior Manager, Public Works Department
Join Our Certified Cities!

Luján de Cuyo, Argentina

Bajo Luján’s Journey to New Housing.

Project Type:
Community Engagement, Environment, Equity, Health and Wellbeing, Infrastructure, Public Safety, Technology, Transportation

At a Glance


Relocated more than 1200 families who lived in flood-prone areas.


Created a workforce development initiative that employed residents, renovated public land and expanded access to recycling centers.


Improved access to territorial data, which made getting land permit data faster—going from months of waiting to just three clicks. The platform, Luján 3D, allows renovations and housing development to have substantial improvements.


Improved accessibility for residents with disabilities through an adapted bicycle program.

In 2016, a survey conducted by the city of Luján de Cuyo, Argentina, revealed a heartbreaking reality. There were about 3,500 families who lived in marginal or informal neighborhoods, of which 700 were concentrated in the Bajo Luján area, often without basic services. The most vulnerable residents lived near a flood-prone river, underscoring the urgency for change. As a result, the City developed an ambitious urbanization and relocation project, supported by the World Bank.

At the heart of the initiative was a resident-driven approach. Residents were surveyed to identify and prioritize needs, including proximity to employment, family size, and level of need to minimize disruption to their daily lives. Efforts to monitor the impact of this relocation were key. A survey and audit process was initiated, capturing residents’ experiences before, during and after the move. This data was visualized through PowerBI dashboards, allowing real-time tracking of project progress.

“Governing is making decisions. Doing it well requires exceptional use of data. If we intend to achieve real impact in the community, our public policies must be data-driven. We dream of becoming an international example of well-managed local government.”

Esteban Allasino, Mayor

The result was the construction of 700 homes in 11 neighborhoods.

This enormous initiative not only provided new homes, but restored a sense of human dignity and trust in government for those who had long been marginalized.

Seven hundred safe and practical homes is a significant achievement.

Additionally, the community intervened and regularized other settlements benefiting 500 families, completing a very ambitious stage that managed to reach more than 35% of the most vulnerable sector of the City.

But the government did not stop there. City leaders knew that housing is only one part of poverty. Thus, in an effort to create employment opportunities, the city turned its attention to residents who worked at the landfills as urban recyclers.

These families made a living collecting recyclable materials from garbage dumps. To help them, the following public policies were promoted: Closure and remediation of garbage dumps, Social inclusion of urban reclaimers, Inclusive Recycling Program – Centro Verde. In this way, the city, together with a group of neighbors, mainly women, officially formed a cooperative. The City provided land and necessary infrastructure.

The Fortress of My Earth, which now has nearly 30 members, launched a program that uses geographic information system (GIS) data to strategically place recycling bins throughout the city. This project successfully increased the number of Green Dots from 8 to 65, ensuring that residents could easily find a container within 500 meters of their homes. This caused a notable increase in recycling from 2021 to 2023.

The story doesn’t end there. In 2021, the City cut the ribbon on Luján Park,  located in the previously abandoned housing settlement Bajo Luján. The area has been transformed into a lively community space, with children’s play areas with equipment made from recycled plastic from the cooperative.

The Bajo Luján and Centro Verde projects reveal how intertwined initiatives can have an exponential impact on residents’ lives. They boosted citywide sustainability, helping hundreds of Luján de Cuyo residents achieve housing stability and financial independence and building much-needed trust in local government.

Join Our Certified Cities!

Rock Hill, South Carolina, USA

Public Transportation Steered By Data

Project Type:
Community Engagement, Environment, Health and Wellbeing, Transportation

At a Glance


The percentage of residents who report using public transportation has more than doubled since their fare-free, all-electric public buses began in 2019.


More than 700 alumni of a 10-week civics course provided to residents by the City.


Increasing tree canopy by planting three trees for every one tree the City cuts down.

Rock Hill, SC, tried public transportation in the 1990s. It wasn’t a roaring success; people didn’t know about it and ridership was low. However, in 2015 a Winthrop University survey found that 80% of respondents identified transportation as a top need. With that data point, Mayor John Gettys knew it was time to give public transportation another go.

Data was a guiding force from the start. The City paired the survey with qualitative data from focus groups that also said fixed-route transit would minimize barriers and provide opportunities to residents. With the need established, choosing routes and schedules were the next items on the agenda. Again, the City leaned on resident feedback, partnering with United Way to hold interest meetings. At the same time, regional planning associations used census data and maps to plot routes that would most benefit residents who needed it most. For instance, they didn’t just look at neighborhood density, they looked at where residents without cars lived, and they made sure that routes passed parks, shopping centers, health care facilities and other places residents recommended.

Image Courtesy of the City of Rock Hill.

“The reason we accomplish big things is that we use data to drive decisions, something the City has done consistently over the last 20 years. I think being strategic and utilizing data to solve challenges attracts good representatives who want to come in and do big things, good things for our community.”

John Gettys, Mayor

“Basing decisions on data can minimize the vitriol of partisan politics, it’s an antidote to a lot of the divide we see in our country today.”

John Gettys, Mayor

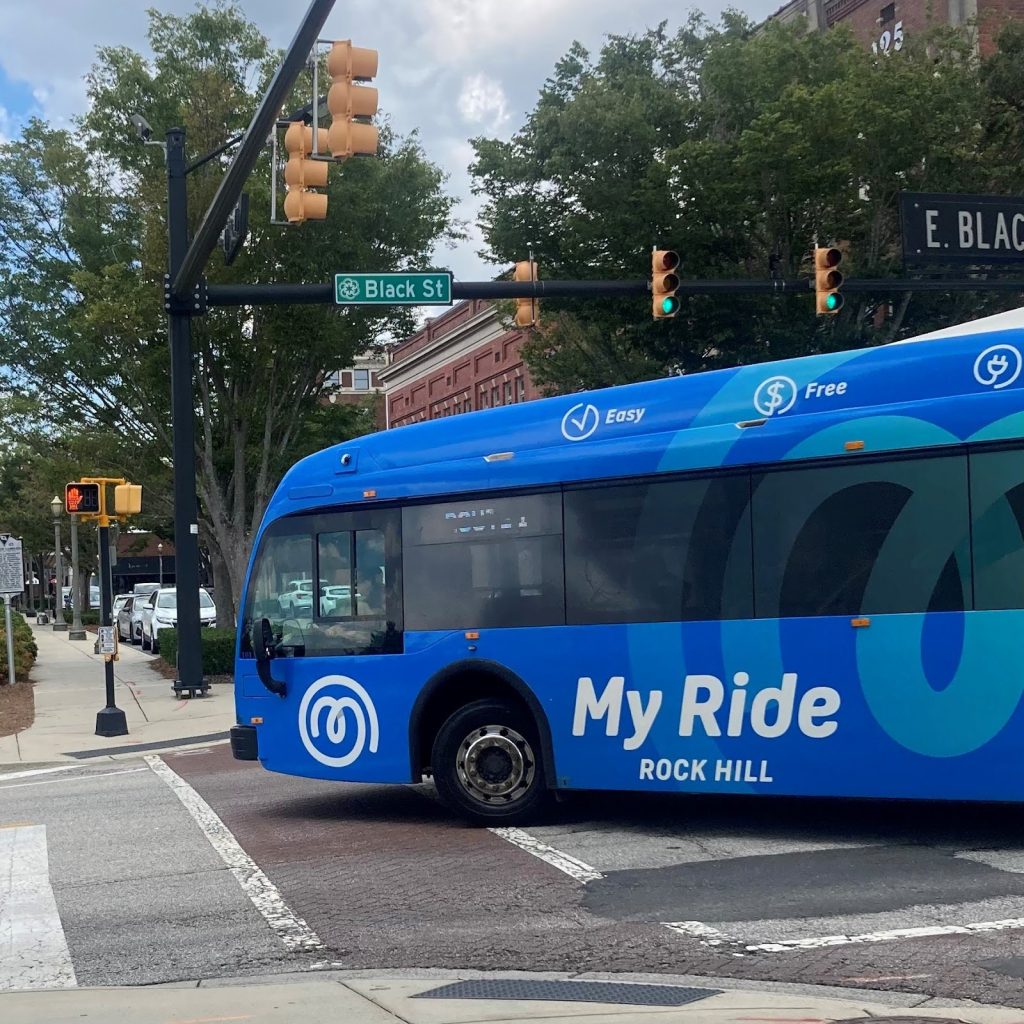
My Ride not only improves accessibility, it’s making a more sustainable Rock Hill. The fleet of 10 buses are all electric and produced in South Carolina. The buses reduced about 337 metric tons of CO2-equivalent emissions compared to diesel buses in just their first year, they’re also quieter for riders and cost less to operate.

Data guided My Ride’s funding decisions as well. Evidence showed that it was cost-prohibitive to collect fares, and city leadership knew how much the buses contributed to accessibility. Thus, the buses are fare-free. Federal Transit Authority (FTA) funds help meet the majority of the costs, the rest is covered by the City and partner organizations.

As My Ride’s success grows, so too do the City’s ambitious goals for the bus system. When the program started, their ridership goal was 4,100 passenger trips per week—a goal they met in less than two months. Despite the plunge in ridership due to the pandemic, ridership has bounced back. In FY23, My Ride’s monthly ridership goal was 16,400. They averaged 20,839 passenger trips per month. And they did all of those rides with only three customer complaints the whole year.

This isn’t the end of the line for My Ride. The four, hour-long routes already serve about two-thirds of city residents, and the City is constantly collecting feedback and setting goals for improvement. For example, in 2023 My Ride began to serve additional areas on the existing routes and improved system efficiency.

Join Our Certified Cities!

New York City, New York, USA

A Data-Driven Process to Reach Net Zero Emissions: Climate Budgeting

Project Type:
Health and Wellbeing, High-Performing Government, Youth Development

At a Glance


100% of City agencies have already submitted emissions impact data with all capital project budget requests


April 2024: When NYC will publish its first Climate Budget.


$4 billion: Amount the City will invest in a school electrification plan, which will contribute a 3% reduction in greenhouse gas emissions from government operations.

Climate Budgeting to Help Reach Zero Net Emissions

New York City has a goal to reach net-zero emissions citywide by 2050.

To reach that goal, city leaders must put data at the heart of day-to-day operations. One way the City is doing this is through a new municipal climate budget. As part of the climate budget, the City bolstered requirements for capital project budget requests to include projected emissions data, which are now being met by 100 percent of city agencies, contributing to a 27 percent reduction in greenhouse gas emissions from government operations.

“Climate budgeting is a significant shift in how we think about the value of tax dollars and their potential to power change. It’s the only way to use every budgeting decision to bring our climate ambitions to life. There’s no time to waste.”

Eric Adams, Mayor

Climate budgeting is a governance system that mainstreams climate targets and considerations into decision-making through the budget process and aligns the City’s resources with its climate goals. It is a paradigm shift from the traditional budget process to a holistic approach that considers the impact of every dollar the City spends on meeting its climate goals.

NYC’s climate budgeting is a core component of the City’s strategic climate plan announced in 2023 and is being led by New York City’s Office of Management and Budget, in partnership with the Mayor’s Office of Climate and Environmental Justice (MOCEJ).

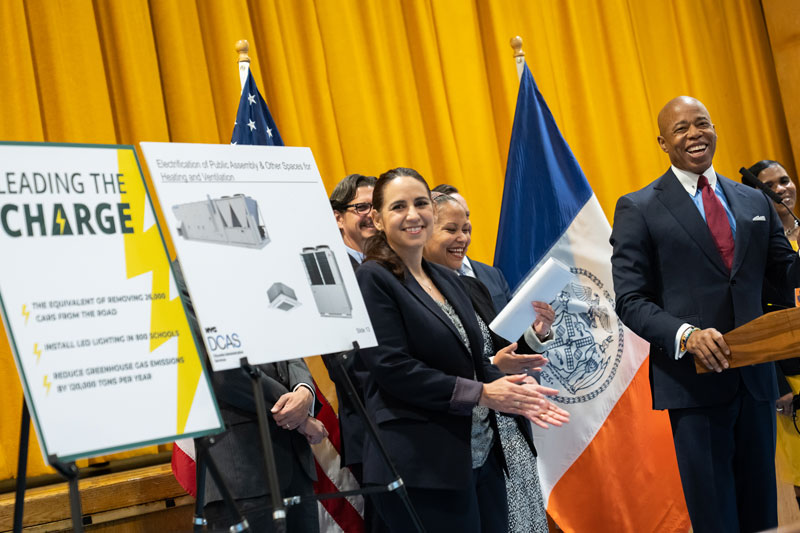
An early example of climate budgeting can be seen in the “Leading the Charge” initiative, a $4 billion plan now in motion, to ensure newly constructed schools will be all-electric and 100 existing schools will begin to phase out fossil fuel heating systems. The initiative will prioritize schools in low-income as well as predominantly Black and Brown communities which are particularly vulnerable to environmental injustices such as elevated rates of childhood asthma. The electrification plan illustrates how NYC is using emissions data to combat climate change and disaggregated demographic data to promote equitable health outcomes.


How else has NYC become a more data-driven government?

As one of the first big cities in the U.S. to adopt climate budgeting, New York City is showing how new decision-making processes can deliver urgently needed change. 

In 2024, it will implement a formal climate budgeting intake form for agency budget requests and publish its first Climate Budget alongside the Executive Budget. The Climate Budget will include a citywide greenhouse gas emissions forecast showing progress toward the 2050 net-zero goal, as well as data that shows how capital project plans could affect climate goals such as air quality and heat and flooding resilience. The 100% compliance rate across departments is a positive sign for standardizing climate budget processes and understanding the City’s emissions.

Does climate budgeting make funding decisions more complex? Yes. But the initiative is worth it. It allows New York City to understand the climate impact of dollars spent and then rally around forward-looking projects aligned to must-reach goals.

“By using a data-driven decision approach, our administration is delivering results for New Yorkers in the most efficient and equitable way possible. Data is more than just a spreadsheet — it is a tool to help government better improve services that impact the daily lives of residents. I’m proud that New York City is recognized as an international leader in operations and look forward to continuing to use data to improve the lives of New Yorkers.”

Sheena Wright, First Deputy Mayor

Charleston, South Carolina, USA

Creating a One-Stop-Shop to Track Progress on City Goals.

Project Type:
Community Engagement, Environment, Equity, Housing, Infrastructure, Public Safety, Technology

At a Glance


Charleston’s TIDEeye app helps the city and its residents monitor the effects of severe weather by providing real-time data on road closures and weather information.


Charleston has added almost 800 affordable housing units since 2016, and 500 more currently in the pipeline.


Data has shown that 86% of the affordable housing units in development are within .5 miles of public transit.


Known as a tourist destination with idyllic horse-drawn carriages, the City optimized equine waste management with GPS tracking. The system helped reduce cleanup time from 40 minutes to 20 minutes.


Using outcomes-based performance management practices to understand if programs are achieving their intended impact.

For cities with competing priorities and limited resources, making city-wide strategic goals built on data and evidence is an achievement in itself. But tracking progress, engaging residents and strengthening accountability is a tougher feat.

In 2022, the City of Charleston outlined six mayoral priorities and launched PriorityStat, an online dashboard and public meeting series to increase transparency and help the City and residents track progress on these six goals. While traditional city open data dashboards are organized around departments or services, PriorityStat takes a more innovative approach and is centered on City—and residents’—priorities.

For instance, FloodStat, one of the dashboards, is focused on protecting the City from sea level rise and flooding. In the 1950s, Charleston was impacted two  days per year on average by nuisance flooding. In the past five years, that average is now 61 days per year. Traditional dashboards would have relevant metrics, such as police complaints about flooded roads and properties, and city carbon emissions, in different dashboards since they’re in different departments. But addressing flooding and coastal challenges requires many departments to effectively work together. FloodStat helps break down silos by developing and regularly tracking metrics that require cross-agency collaboration. Additionally, it gives residents one place to see a more complete and clear picture of how the City is combatting its challenges.

Another one of the mayoral priorities is affordable housing. Home prices have jumped 78% since 2011 in Charleston—an unsurprising trend for a City with a 25% population increase since 2010 and more than 7 million visitors each year.

HousingStat allowed Charleston officials to develop a 10-year comprehensive plan to improve housing. To eliminate affordability gaps by 2030, the City learned that it needs more than 16,000 affordable units. HousingStat has also led to new programs, such as a Senior Homeowner Initiative, that has already helped 18 seniors become first-time homeowners. Regularly disaggregated data has helped the City allocate resources where they are needed most and develop more targeted strategies.

“We’ve been able to cut red tape on affordable housing initiatives. This is the largest, most ambitious affordable and workforce housing initiative in our city’s history.”

John Tecklenburg, Mayor

The City is clear that PriorityStat is still a work in progress. Two more dashboards are on the docket for 2024: one for mobility and transportation, and the other for neighborhood livability and resident quality of life. While these are being built, the City is actively seeking feedback and encouraging residents to watch public meetings on Charleston’s YouTube page.

PriorityStat is a performance management grand slam for the City. But more importantly it’s a win for residents. An unwieldy and unorganized performance management dashboard isn’t a platform that performs for residents. Charleston’s PriorityStat is different: by embedding accountability, transparency and collaboration into the fabric of the City’s strategic goals, residents know the City is making strides with them in mind.

Join Our Certified Cities!

Disclaimer