Dallas, Texas, USA

An All-In Approach to More Equitable Budget Decisions

Project Type:
Community Engagement, Environment, Health and Wellbeing, Transportation

At a Glance


Used disaggregated data to drive budget decisions that address inequities based on race and/or income. All 42 city departments contributed to the establishment of over 220 metrics that are tracked publicly through the Racial Equity Plan, of which $40 million was allocated towards equity investments.


Launched the first Spanish-language 311 mobile app of any big city in Texas.


Reduced the number of steps in the procurement process from 82 to 23, speeding up the time it takes the city to purchase goods and services.

City leaders in Dallas know that if you want to get something done in local government, the budget is a good place to start. So when they took on the goal of creating a more equitable city, that’s exactly what they did.

The result is a process Dallas calls Budgeting for Equity. Rooted in sophisticated data practices, it’s one of the most robust City Hall systems in place anywhere for identifying and addressing disparities.

The effort began in 2019, with publication of the Dallas Equity Indicators report. The report measured equity across 60 social and economic indicators, from business ownership to home loan denials to kindergarten readiness. It also provided baseline data for local leaders to track citywide equity changes over time.

Next, eight departments used the equity indicators to identify disparities and change budgets to address them. For example, the 311 customer service center noticed that wait times were longer for Spanish-speaking residents. In response, the department hired bilingual staff and recently became the first big city in Texas to launch a Spanish-language 311 mobile app.

Budgeting for Equity has since expanded across all of city government. It’s led by the Office of Equity & Inclusion –in collaboration with the Office of Budget Management Services which guides the City’s 42 departments as they use a tool the Office created to help them prioritize equity in their budgets. Departments are required to use disaggregated data so they can spot disparities within the services they provide by race, ethnicity, age and other factors. They also must consider how their budgets may produce both positive and negative impacts in communities of color and lower-income neighborhoods.

“It’s easy to talk about the ways we’re helping people,” says Dr. Lindsey Wilson, Dallas’ Director of Equity & Inclusion. “But how are we also burdening communities? We need to not only talk about the good things but also the not-so-good things that data is telling us.”

What makes Dallas’ efforts stand out from what other cities are doing is its thoroughness. Budgeting for Equity is not an occasional activity for a handful of departments at a time — in Dallas, every department does it every year. The process is aligned with a comprehensive Racial Equity Plan the City Council adopted in 2022, which includes a set of “Big Audacious Goals” meant to guide implementation of that plan; progress is continually tracked in a public dashboard. Individual departments in charge of libraries, arts and culture, planning, and water, have earned recognition from their own industry organizations. 

“Each year we hear from departments about adjustments we need to make,” Dr. Wilson says, noting that the number of questions departments are asked to answer through Budgeting for Equity has been reduced from ten to five to reduce burdens on them. “The one thing that never changed was the use of data to drive the outcomes.”


60 citywide measures included in Dallas’ Equity Indicators Report


3,203 individuals and 284 organizations were directly engaged in creation of the Racial Equity Plan.


5 “Big Audacious Goals” in the Racial Equity Plan

“If we continue to strengthen and hold ourselves accountable for this work, we should see disparities decrease and begin to see transformative change.”

Dr. Lindsey Wilson, Director Dallas Office of Equity & Inclusio
Join Our Certified Cities!

Luján de Cuyo, Argentina

Bajo Luján’s Journey to New Housing.

Project Type:
Community Engagement, Environment, Equity, Health and Wellbeing, Infrastructure, Public Safety, Technology, Transportation

At a Glance


Relocated more than 1200 families who lived in flood-prone areas.


Created a workforce development initiative that employed residents, renovated public land and expanded access to recycling centers.


Improved access to territorial data, which made getting land permit data faster—going from months of waiting to just three clicks. The platform, Luján 3D, allows renovations and housing development to have substantial improvements.


Improved accessibility for residents with disabilities through an adapted bicycle program.

In 2016, a survey conducted by the city of Luján de Cuyo, Argentina, revealed a heartbreaking reality. There were about 3,500 families who lived in marginal or informal neighborhoods, of which 700 were concentrated in the Bajo Luján area, often without basic services. The most vulnerable residents lived near a flood-prone river, underscoring the urgency for change. As a result, the City developed an ambitious urbanization and relocation project, supported by the World Bank.

At the heart of the initiative was a resident-driven approach. Residents were surveyed to identify and prioritize needs, including proximity to employment, family size, and level of need to minimize disruption to their daily lives. Efforts to monitor the impact of this relocation were key. A survey and audit process was initiated, capturing residents’ experiences before, during and after the move. This data was visualized through PowerBI dashboards, allowing real-time tracking of project progress.

“Governing is making decisions. Doing it well requires exceptional use of data. If we intend to achieve real impact in the community, our public policies must be data-driven. We dream of becoming an international example of well-managed local government.”

Esteban Allasino, Mayor

The result was the construction of 700 homes in 11 neighborhoods.

This enormous initiative not only provided new homes, but restored a sense of human dignity and trust in government for those who had long been marginalized.

Seven hundred safe and practical homes is a significant achievement.

Additionally, the community intervened and regularized other settlements benefiting 500 families, completing a very ambitious stage that managed to reach more than 35% of the most vulnerable sector of the City.

But the government did not stop there. City leaders knew that housing is only one part of poverty. Thus, in an effort to create employment opportunities, the city turned its attention to residents who worked at the landfills as urban recyclers.

These families made a living collecting recyclable materials from garbage dumps. To help them, the following public policies were promoted: Closure and remediation of garbage dumps, Social inclusion of urban reclaimers, Inclusive Recycling Program – Centro Verde. In this way, the city, together with a group of neighbors, mainly women, officially formed a cooperative. The City provided land and necessary infrastructure.

The Fortress of My Earth, which now has nearly 30 members, launched a program that uses geographic information system (GIS) data to strategically place recycling bins throughout the city. This project successfully increased the number of Green Dots from 8 to 65, ensuring that residents could easily find a container within 500 meters of their homes. This caused a notable increase in recycling from 2021 to 2023.

The story doesn’t end there. In 2021, the City cut the ribbon on Luján Park,  located in the previously abandoned housing settlement Bajo Luján. The area has been transformed into a lively community space, with children’s play areas with equipment made from recycled plastic from the cooperative.

The Bajo Luján and Centro Verde projects reveal how intertwined initiatives can have an exponential impact on residents’ lives. They boosted citywide sustainability, helping hundreds of Luján de Cuyo residents achieve housing stability and financial independence and building much-needed trust in local government.

Join Our Certified Cities!

Tres de Febrero, Argentina

Making Health Care the Starting Point of Community

Project Type:
Equity, Health & Wellness, High-Performing Government, Technology

At a Glance


15 minutes: The longest a resident in a target population needs to travel to reach a primary health center.


More than 50% of the local population is registered in the municipal public health system, with the proposed minimum goal being 35% (population with only public coverage).


Reduced emergency response time from an average of 60 minutes to 10 minutes, improving public safety and health outcomes.

There is a difference between having the right to health care and having access to health care.

In Argentina, health services are divided among levels of government, and while the country does have universal health care, many residents—especially vulnerable populations—lack access to critical health services. In the 24 municipalities that make up Greater Buenos Aires, 50% of people live in poverty and 54% do not have access to at least some public services.

Given this significant disparity in access, Tres de Febrero, a municipality of 350,000 in the Buenos Aires metro area, understood that it would take transformational change to solve its health care problem.

First, the City analyzed its community needs to identify a priority population of residents who lacked access to government-provided healthcare. The City embarked on an inside-out transformation of its health system with three strategies:

1) Digitize

  • Tres de Febrero invested in key digital infrastructure across its health services. This allowed the City to provide more efficient, more accurate and more user-friendly services for residents when they made appointments, filled prescriptions, got blood work, and more. Crucially, the City also transitioned from paper patient records to digital medical profiles, which directly improves patient care by enabling greater data sharing between health providers and faster access to information for patients. Through coordinated enrollment plans with the electronic registry, Tres de Febrero was able to reach a 100% enrollment rate.

2) Decentralize

  • A core challenge that Tres de Febrero faced was the distribution of its health services and primary care centers (CAPS). Using geographical data about its target population, the City built two new CAPS in strategic locations so that no one in the target population had to travel more than 15 minutes for primary care. They also increased the number of CAPS that could provide specialized services such as dentistry, gynecology and mental health care. For instance, in 2021, only one CAPS had a lab that could do blood tests. By 2023, all 14 centers could.

3) Revitalize

  • Previously, CAPS centers did not exemplify healthy community spaces. They were dilapidated, with exposed electrical wire, flaking paint and visible mold. Being in the buildings did not make residents feel good. Thus, the City renovated more than 14 health care facilities to improve quality of care.
Image courtesy of the Municipality of Tres de Febrero.

“It is not possible for me to pay for a gym membership, but I have been here every day to exercise because there is space to do so.”

Resident speaking about renovated public exercise space

The numbers in Tres de Febrero speak for themselves. The transformation has touched every branch of the City’s health system: emergency response times have dropped by 82%, lab results come in three days, not two weeks, and more than 450 medical professionals have participated in the city’s continuing training program.

This sweeping and dramatic improvement in how Tres de Febrero serves its residents was made possible by data. Tres de Febrero has done more than build health centers: It has created equitable community spaces that build trust in government, deepen community bonds and make lives better.

“As a neighbor, I can see the impact of using data to improve the lives of residents and the community.”

Ailén Gómez, Líder de Seguimiento

“Certification is a valuable tool for mayors. Using data and evidence adds value to strategic planning and increases your chances of success. Using data is essential but it is not enough. You also need to have empathy and political leadership is how you change people’s lives.”

Diego Valenzuela, Mayor

Join Our Certified Cities!

Bogotá, Colombia

Bogotá’s Evidence-Based Approach to Empowering Caregivers

Project Type:
Community Engagement, Equity, Health and Wellbeing, Technology

At a Glance


The district administration built 21 Care Blocks, community centers that have provided support to more than 180,000 female caregivers and their families since January 2022.


Since its inception, the services of the Bogotá Care System have improved the lives of more than 546,500 women and their families. In 2023, it helped more than 550 women receive their high school diploma.


Through the Bogotá Public Innovation Laboratory – iBO, the Care Blocks are implementing new registration technology through a chatbot. The first stage managed to integrate more than 2,400 women to the system.


They successfully combined the use of data and feedback from residents to build a social support program that promotes economic mobility.

In a pioneering initiative aimed at supporting caregivers, Bogotá has successfully established 21 community centers throughout the city called Care Blocks.

During a visit from the What Works Cities Certification team to a Care Block in the Manitas neighborhood in the town of Ciudad Bolívar, which is considered a vulnerable area, the impact of the program was evident. As people danced and celebrated the Care Block’s third anniversary, caregivers expressed gratitude for the opportunity to receive support to improve their lives.

Care Blocks are designed to relieve the responsibilities and stress of caregiving. The goal is to allow caregivers to focus on other essential aspects of their lives that often get pushed aside due to their duties. All services provided are free, including community laundries. With these, more than 14,700 hours of care work were freed up for women, equivalent to 616 days.

According to the District Secretariat for Women, since January 2022, more than 180,000 female caregivers and their families have participated in the Care Blocks.

Image Courtesy of the City of Bogotá.

The District is actively involved in improving the program. Thanks to the Bogotá Public Innovation Laboratory – iBO, they are developing a system to register people in various activities offered in the Care Blocks, using a recently implemented chatbot to address queries and facilitate registrations. There are more than 2,100 engagements with the chatbot.

The results for residents and the emphasis of digitization and data have attracted the attention of leaders across the city and the country as a model to improve the lives of residents. Efforts are underway to conduct a comprehensive impact assessment and increase outreach.

Bogotá’s pioneering initiative highlights the cultural evolution around care. This model is proving to be a catalyst for positive change in the lives of caregivers throughout the city and a reference for other cities to follow.

“Here we can continue studying and fulfill our dreams. We [caretakers] are always told: ‘This is going to inhibit you and you will not be able to move forward,’ but this program really helps us a lot.”

Tatiana Guayara, San Cristóbal Care Block beneficiary (quote provided by the City)
Image Courtesy of the City of Bogotá.

“With this Certification it is evident that Bogotá has put data, technology and innovation at the center of government decisions on critical issues such as the District Care System, the environment and mobility. Our commitment is to continue with this effort, build on what has been built and continue promoting a conscious, responsible and strategic use of information to improve the quality of life of citizens.”

Carlos Fernando Galán Pachón, Mayor

550 caretakers have earned their high school diploma through Care Blocks

Join Our Certified Cities!

Medellín, Colombia

Medellín’s Data Breakthrough Reduces Teen Pregnancy by 54%

Project Type:
Community Engagement, Equity, Health and Wellbeing, Technology

At a Glance


Invested significantly in data infrastructure during the pandemic, resulting in increasing the number of intensive care units from 300 to 1000.


In 2020, there were 3,792 teenage pregnancies. As of November 2023, that number was 1,743.


More than 626 public datasets and 61 open data dashboards and visualizations.


Pico y Placa traffic program reduced road congestion by 50%.

Latin America is a region with one of the highest rates of underage pregnancy in the world, and Medellín, Colombia, is not immune to the trend. In 2020, 40 in every 1,000 teenage girls became pregnant in the city of 2.5 million.

Teenage pregnancy comes with higher health risks for the mother and child, severely impedes economic mobility and has well-documented social costs. A few years ago, Medellín’s data related to teenage pregnancy lived under the umbrella of the Health Department. Yet, teenage pregnancy is influenced by health, social, economic and cultural factors—data in a silo meant Medellín was missing the big picture.

In 2020, at the height of the pandemic, Medellín leadership recognized that the City needed significant and rapid investment in data. Former Mayor Daniel Quintero created the Digital Innovation Secretariat in September 2020, which prioritized investing in data infrastructure and innovation, and set the stage for lasting culture change. At the same time, the City laid out its strategic priorities in a development plan that included a focus on health. A reduction in the pregnancy rate of adolescents 10 to 19 years old was chosen as a key health indicator.

From there, the solution happened in three stages:

  1. Modernizing data management. City leaders transformed how the government manages data. The process of creating a centralized repository of data started with knocking on department doors asking for Excel spreadsheets, Powerpoints and other files with stored data. It took “plenty of love and plenty of patience,” said team member Julio Cesar Mendoza. But the labor of love was worth it: Now the City has access to essential insights into every policy and program.
  2. Co-creating solutions. Next, leaders from various government departments and community organizations held sessions to determine the best metrics to track and strategies to try to prevent teen pregnancy, including disaggregating data by neighborhood, age, marital status, education level and more (such as whether the mother had subsequent pregnancies.) Based on the data, this group found that schools were the most effective place to focus pregnancy prevention efforts, and that educating and empowering school-aged children would be critical to reducing early motherhood.
  3. Engaging the Community. These findings sparked a comprehensive community engagement campaign. Most significantly this includes the “I Decide When” campaign, a strategy across 11 city departments that focuses on the social determinants of teenage pregnancy and uses data to dictate tactics. For instance, there is a chatbot for sex education. Additionally, the City held a contest for schools to come up with ideas to prevent teenage pregnancy. The winning school was in a neighborhood with a high rate of adolescent pregnancy.
Image Courtesy of the City of Medellín.

Today, Medellín’s efforts to reduce teenage pregnancy continue. And with its strong data foundation, the City is committed to making headway on other policy priorities, such as reducing child malnutrition and expanding universal education. Learn more about how data is changing lives in Medellín.

“Our ultimate goal and obligation as public servants is the improvement of the quality of life of our citizens. Thus, when we identified a gap between the speed at which the city and citizens were progressing with data versus how the government was advancing, we began this entire transformation process.”

Ana Maria Valencia Cáceres, Subsecretaría de Ciudad Inteligente de la Secretaría Innovación Digital

“We created all the infrastructure and investment to increase internal capacity in terms of innovation: the Digital Innovation Secretary, technology and specifically increased capacity for data use.”

Mayor Óscar de Jesús Hurtado Pérez

5% of City revenue is allocated each year to projects chosen by residents in Medellín’s participatory budgeting process.

Join Our Certified Cities!

Alexandria, Virginia, USA

Data & Community Partnerships Key to Addressing Evictions in Alexandria

Project Type:
Community Engagement, Equity, Housing

At a Glance


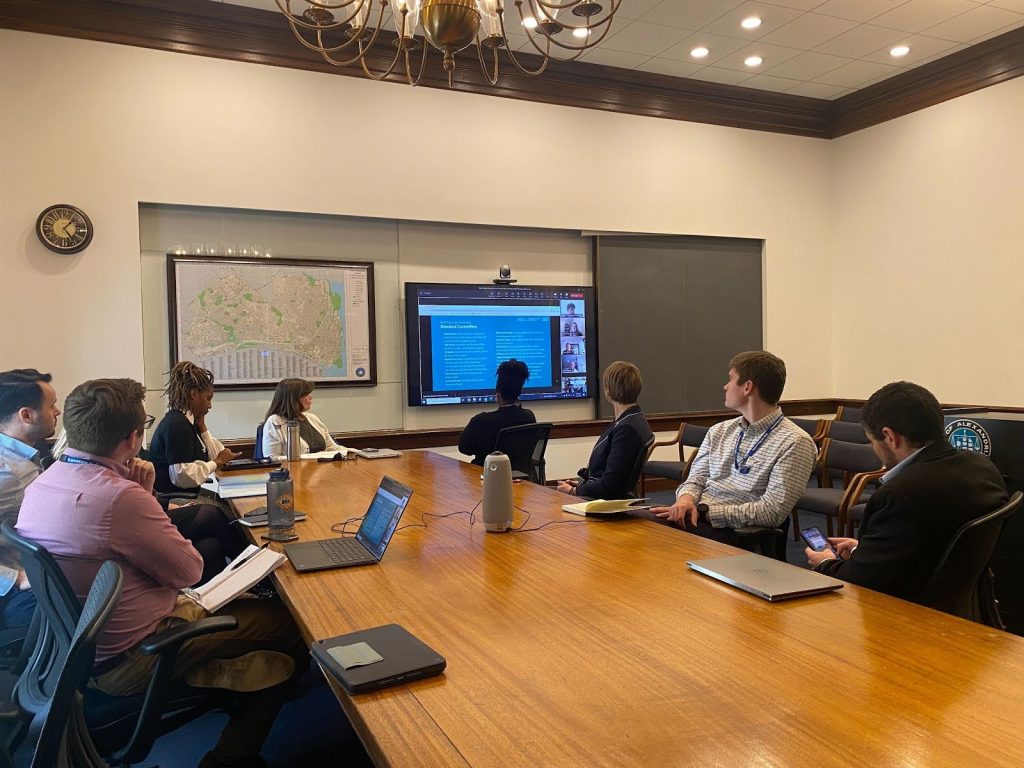
Developed an automated system for gathering information on eviction court proceedings. The data informs the efforts of the Eviction Prevention Task Force, a City-community partnership that supports households at risk of eviction.


Since the CDC moratorium ended in August 2021 to the end of 2023, 7,968 evictions have been filed in Alexandria. With support provided by the Task Force and other community partners, only 1,018 of those evictions resulted in a resident being removed from their home.


An independent evaluation of the Alexandria Co-Response Program (ACORP) found that when its teams of trained law enforcement officers and behavioral health clinicians responded to 911 calls that could have resulted in arrests, 70% were diverted from legal action.


Launched an Equity Index Map in 2023 to identify disparities in key social and economic outcomes and to help city staff and community partners make equitable, inclusive and data-driven decisions.


Maintains 92 datasets and dashboards that track how well City programs are working, provide transparency to the community, and help inform collaborations with residents and stakeholders.

Housing affordability has been a priority and a work in-progress for the City of Alexandria for over a decade. Even before the economic volatility of the pandemic, 89% of renters earning $50,000 or less were housing cost burdened and paying over 30% of their incomes in rent. When the pandemic hit, many of these households had little financial buffer.

Hoping to stem a tide of evictions, legal and housing advocates across the city jumped into action. Rather than duplicate the work of local organizations, in June 2020, the City formed an Eviction Prevention Task Force to bring together local nonprofits, faith organizations, and City departments to share information and coordinate efforts.

“We have boots on the ground. We are triaging emergencies. This partnership with the City and faith-based community and nonprofits is unique to Alexandria,” Mary Horner, a housing attorney for Legal Services of Northern Virginia, said in July 2020. “It is the benefit of our size and our tight-knit community. Everyone is on the same team.”

One strength, in particular, the City brought to the partnership was in data collection and analytics. Legal Services of Northern Virginia had been collecting publicly available data on eviction proceedings from the Alexandria General District Court to guide outreach efforts to at-risk households – but that data collection was taking hours each week. The City’s Office of Performance Analytics (OPA) used funding from the American Rescue Plan Act to hire a data analyst to work with the Task Force. The analyst assessed the situation, built a web scraper that reduced the weekly data collection process to a few minutes, and developed a dashboard to follow trends and changes in the eviction landscape.

“We have boots on the ground. We are triaging emergencies. This partnership with the City and faith-based community and nonprofits is unique to Alexandria. It is the benefit of our size and our tight knit community. Everyone is on the same team.”

Mary Horner, Housing Justice Senior Staff Attorney, Legal Services of Northern Virginia

Coordinated, data-based outreach efforts by Task Force partners paired with state and local rental assistance proved incredibly effective in preventing evictions. Between June 2020 and September 2021, City departments helped 3,717 households secure city and state rental assistance.  In 2021, control of rental relief funds transitioned from local government to state government. From January 2021 to December 2023, Legal Services of Northern Virginia – with financial support from the City – provided legal assistance to over 3,500 people through courthouse outreach, representing 17% of tenants facing eviction.

The Task Force’s role has evolved with the changing eviction landscape. Pandemic-era federal and state eviction moratoriums and rental assistance programs have ended, yet evictions legally served to tenants are still below pre-pandemic levels. But the approach of using data and partnerships to improve housing stability is still producing positive outcomes. For example, when a state rental assistance program ended in 2022, a local church asked how much it would cost to stop evictions for the remainder of the year. Using data on the average amount of unpaid rent, the Task Force could answer and the church donated the money.

The City of Alexandria’s strong data foundation and investment in staff capacity made it a productive partner in the Eviction Prevention Task Force, helped bring housing stability to thousands of residents during the pandemic, and are informing the City’s ongoing efforts towards increasing housing affordability.

“The [Eviction Prevention] Task Force has done an impressive amount of work and, as you can see in the numbers, it’s making results. During the pandemic I saw a report that suggested that Virginia had the highest rate of any of the states in allocating federal rental assistance funds. That’s impressive for the entire commonwealth, but I would argue that it’s our efforts in Alexandria that probably made most of that happen.”

Mayor Justin Wilson

Join Our Certified Cities!

Rochester, Minnesota, USA

Breaking Down Barriers to Build a Diverse Workforce.

Project Type:
Community Engagement, Finance, Health and Wellbeing, Infrastructure, Public Safety, Transportation

At a Glance


Among 631 entries from around the globe, Rochester was one of only 15 cities to be awarded a $1 million grant from Bloomberg Philanthropies’ Mayors Challenge in 2021.


Established Equity in the Built Environment, a flagship program to increase workforce participation for women of color in built environment industries

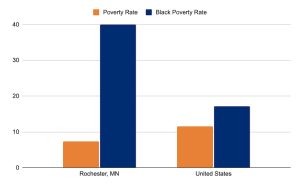
Overall, Rochester, MN’s poverty rate is part success story, part call for action. The city’s 7.4% poverty rate is well below the national average of 11.5%. But equity is top of mind for city leaders, and when they dug deeper to examine who in their community are struggling, they found an alarming disparity. Four in ten Black Rochester residents live in poverty—far above the citywide rate and more than double the national poverty rate for Black Americans. City leaders recognized addressing such a large disparity required a new way of thinking and fundamental changes. 

In 2020 the City of Rochester named Chao Mwatela as the first Diversity, Equity and Inclusion Director. Instead of coming in with a laundry list of action items, she began by identifying potential priority areas using disaggregated data. Then, Mwatela focused on building relationships and listening. She spent time learning about past equity efforts and made recommendations based on what she heard from residents, City staff, and community organizations. A consensus emerged that in order to create a more equitable Rochester,  intentional engagement of the community members most impacted should take priority—this practice is a critical component of WWC Certification.

Also in 2020, the City participated in the Bloomberg Global Mayor’s Challenge which asked cities to identify new solutions for a persistent problem in their city. Rochester identified a problem and an opportunity – inequitable access for women of color to well-paying built environment careers. Nationally, women occupy about one in 10 construction jobs. In Southeast Minnesota, women of color are employed in less than 2% of built environment careers yet represent 13% of the population. As home to the renowned Mayo Clinic, Rochester is undertaking a $5.6 billion public-private economic development plan to elevate the city and solidify its standing, globally, as a leader in healthcare and medical research. Community groups, City leaders, and DMC stakeholders recognized that intentional growth should prioritize equitable results, so everyone in the community benefits. One opportunity, made clear by the data, is for Rochester to recruit more women of color in built environment careers to meet these ambitious construction plans.

Together–using a co-design methodology–women of color and built environment professionals, along with representatives from Rochester Schools, Workforce Development Inc, and the City of Rochester created the Equity in the Built Environment program.

The program includes:

  • K-12 career exploration,
  • Training and mentorship for women of color,
  • Inclusive Workplace Employer (I/WE) designation for built environment employers hiring from the program, and
  • Entrepreneurship support for women of color starting a built environment business.
Photo Courtesy of the City of Rochester

Their efforts have been recognized. In 2021, Rochester was one of 15 global cities to receive a $1 million grant as part of the Bloomberg Philanthropies Mayors Challenge. Their award is focused on building a system that creates access to women of color into built environment careers. This system consists of education, workforce development, trades unions, and private employer partners all working in collaboration to ensure success for women of color. As of January 2024:

  • Four commercial construction companies earning their Inclusive Workplace Employer designation.

  • Thirteen women involved in built environment training or entrepreneurship .

  • Over one hundred 11th grade students were exposed to built environment careers through experiential learning economics curriculum.

  • A built environment framework now supports women of color on their chosen career path from training to employment and beyond.

 More than anything, Rochester’s data story is about using data to see innovative ways to solve problems and create opportunities. It’s about economic growth being a benefit for all residents and a catalyst for equity. While the program is early in the implementation phase, it’s poised for success. By developing solutions with residents, the City has used data to create pathways to high-paying careers, enhancing economic mobility for historically marginalized communities.

“Aggregate data is meaningful, but does not tell us the stories and experiences of specific communities – those most impacted in our communities. It is imperative that we disaggregate data to understand impacts to specific groups and communities.”

Chao Mwatela, Diversity, Equity and Inclusion Director

“What Works Cities Certification shows the community that our staff are not only trained and certified in the use of data, but that we’re actually using data to make progress and being recognized for it. In a time of widespread distrust of government, having What Works Cities Certification is a chance to increase trust in government.”

Kim Norton, Mayor

Join Our Certified Cities!

New York City, New York, USA

A Data-Driven Process to Reach Net Zero Emissions: Climate Budgeting

Project Type:
Health and Wellbeing, High-Performing Government, Youth Development

At a Glance


100% of City agencies have already submitted emissions impact data with all capital project budget requests


April 2024: When NYC will publish its first Climate Budget.


$4 billion: Amount the City will invest in a school electrification plan, which will contribute a 3% reduction in greenhouse gas emissions from government operations.

Climate Budgeting to Help Reach Zero Net Emissions

New York City has a goal to reach net-zero emissions citywide by 2050.

To reach that goal, city leaders must put data at the heart of day-to-day operations. One way the City is doing this is through a new municipal climate budget. As part of the climate budget, the City bolstered requirements for capital project budget requests to include projected emissions data, which are now being met by 100 percent of city agencies, contributing to a 27 percent reduction in greenhouse gas emissions from government operations.

“Climate budgeting is a significant shift in how we think about the value of tax dollars and their potential to power change. It’s the only way to use every budgeting decision to bring our climate ambitions to life. There’s no time to waste.”

Eric Adams, Mayor

Climate budgeting is a governance system that mainstreams climate targets and considerations into decision-making through the budget process and aligns the City’s resources with its climate goals. It is a paradigm shift from the traditional budget process to a holistic approach that considers the impact of every dollar the City spends on meeting its climate goals.

NYC’s climate budgeting is a core component of the City’s strategic climate plan announced in 2023 and is being led by New York City’s Office of Management and Budget, in partnership with the Mayor’s Office of Climate and Environmental Justice (MOCEJ).

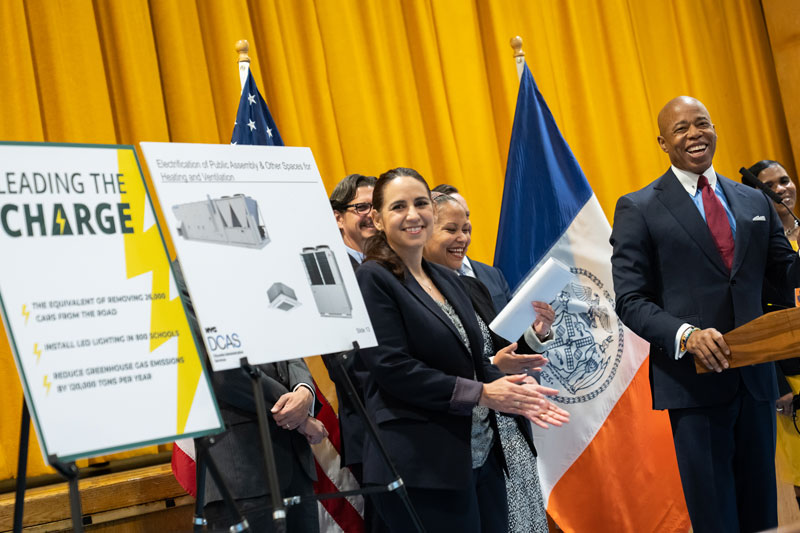
An early example of climate budgeting can be seen in the “Leading the Charge” initiative, a $4 billion plan now in motion, to ensure newly constructed schools will be all-electric and 100 existing schools will begin to phase out fossil fuel heating systems. The initiative will prioritize schools in low-income as well as predominantly Black and Brown communities which are particularly vulnerable to environmental injustices such as elevated rates of childhood asthma. The electrification plan illustrates how NYC is using emissions data to combat climate change and disaggregated demographic data to promote equitable health outcomes.


How else has NYC become a more data-driven government?

As one of the first big cities in the U.S. to adopt climate budgeting, New York City is showing how new decision-making processes can deliver urgently needed change. 

In 2024, it will implement a formal climate budgeting intake form for agency budget requests and publish its first Climate Budget alongside the Executive Budget. The Climate Budget will include a citywide greenhouse gas emissions forecast showing progress toward the 2050 net-zero goal, as well as data that shows how capital project plans could affect climate goals such as air quality and heat and flooding resilience. The 100% compliance rate across departments is a positive sign for standardizing climate budget processes and understanding the City’s emissions.

Does climate budgeting make funding decisions more complex? Yes. But the initiative is worth it. It allows New York City to understand the climate impact of dollars spent and then rally around forward-looking projects aligned to must-reach goals.

“By using a data-driven decision approach, our administration is delivering results for New Yorkers in the most efficient and equitable way possible. Data is more than just a spreadsheet — it is a tool to help government better improve services that impact the daily lives of residents. I’m proud that New York City is recognized as an international leader in operations and look forward to continuing to use data to improve the lives of New Yorkers.”

Sheena Wright, First Deputy Mayor

Charleston, South Carolina, USA

Creating a One-Stop-Shop to Track Progress on City Goals.

Project Type:
Community Engagement, Environment, Equity, Housing, Infrastructure, Public Safety, Technology

At a Glance


Charleston’s TIDEeye app helps the city and its residents monitor the effects of severe weather by providing real-time data on road closures and weather information.


Charleston has added almost 800 affordable housing units since 2016, and 500 more currently in the pipeline.


Data has shown that 86% of the affordable housing units in development are within .5 miles of public transit.


Known as a tourist destination with idyllic horse-drawn carriages, the City optimized equine waste management with GPS tracking. The system helped reduce cleanup time from 40 minutes to 20 minutes.


Using outcomes-based performance management practices to understand if programs are achieving their intended impact.

For cities with competing priorities and limited resources, making city-wide strategic goals built on data and evidence is an achievement in itself. But tracking progress, engaging residents and strengthening accountability is a tougher feat.

In 2022, the City of Charleston outlined six mayoral priorities and launched PriorityStat, an online dashboard and public meeting series to increase transparency and help the City and residents track progress on these six goals. While traditional city open data dashboards are organized around departments or services, PriorityStat takes a more innovative approach and is centered on City—and residents’—priorities.

For instance, FloodStat, one of the dashboards, is focused on protecting the City from sea level rise and flooding. In the 1950s, Charleston was impacted two  days per year on average by nuisance flooding. In the past five years, that average is now 61 days per year. Traditional dashboards would have relevant metrics, such as police complaints about flooded roads and properties, and city carbon emissions, in different dashboards since they’re in different departments. But addressing flooding and coastal challenges requires many departments to effectively work together. FloodStat helps break down silos by developing and regularly tracking metrics that require cross-agency collaboration. Additionally, it gives residents one place to see a more complete and clear picture of how the City is combatting its challenges.

Another one of the mayoral priorities is affordable housing. Home prices have jumped 78% since 2011 in Charleston—an unsurprising trend for a City with a 25% population increase since 2010 and more than 7 million visitors each year.

HousingStat allowed Charleston officials to develop a 10-year comprehensive plan to improve housing. To eliminate affordability gaps by 2030, the City learned that it needs more than 16,000 affordable units. HousingStat has also led to new programs, such as a Senior Homeowner Initiative, that has already helped 18 seniors become first-time homeowners. Regularly disaggregated data has helped the City allocate resources where they are needed most and develop more targeted strategies.

“We’ve been able to cut red tape on affordable housing initiatives. This is the largest, most ambitious affordable and workforce housing initiative in our city’s history.”

John Tecklenburg, Mayor

The City is clear that PriorityStat is still a work in progress. Two more dashboards are on the docket for 2024: one for mobility and transportation, and the other for neighborhood livability and resident quality of life. While these are being built, the City is actively seeking feedback and encouraging residents to watch public meetings on Charleston’s YouTube page.

PriorityStat is a performance management grand slam for the City. But more importantly it’s a win for residents. An unwieldy and unorganized performance management dashboard isn’t a platform that performs for residents. Charleston’s PriorityStat is different: by embedding accountability, transparency and collaboration into the fabric of the City’s strategic goals, residents know the City is making strides with them in mind.

Join Our Certified Cities!

Syracuse, New York, USA

In Syracuse, Data Delivers Efficient, Effective and Equitable Services.

Project Type:
Equity, Finance, High-Performing Government, Housing, Infrastructure

2023 Gold Certification


Several years ago the City of Syracuse teamed up with the Syracuse Metropolitan Transportation Council (SMTC) to create a data-driven prioritization for road reconstruction. This year, the City and SMTC introduced an equity component to the priority scoring process to ensure that the City does not overlook roads in historically underserved neighborhoods. Inspired by equity score systems in other cities, the City created a metric to measure the amount of historically underserved residents in an area. The new model considers the equity score as well as road conditions when recommending reconstruction projects for the year. In this way, the City avoided completely reinventing the reconstruction priority process while introducing equity as an additional factor.

2021 Silver Certification


Compiled data from GPS units in each snowplow, allowing the city to create and publish an interactive map for residents to determine if a street was already plowed and allowing city staff to quickly identify any streets a snowplow may have missed on its run.


Created a database mapping sidewalks and walkways in 164 parks in order to improve its approach to snow removal, empowering the city to lower the average time to clear paths of snow from 3 days to 6 hours.


Gave city departments centralized access to budgeted and actual financial data, allowing staff to better predict funding needs and allocate resources. Analysis from this data saved the city an estimated $800,000 on salt used for de-icing.


Determined locations for new affordable housing construction by gathering and analyzing quantitative data on the locations of vacant properties and qualitative data from 800 resident interviews.

The Snowiest City

Syracuse, New York is seriously snowy. Averaging more than 120 inches of snowfall each year, it’s officially the country’s snowiest city. Throughout each long winter, staff in the Department of Public Works (DPW) work to keep roads and sidewalks clear and safe so residents can keep moving. Until a few years ago, Syracuse’s snow removal services were challenged, resources were limited, and many residents weren’t happy.

“I used to want to avoid Facebook every time we had a storm,” says Corey Dunham, the City’s chief operating officer. “There were just too many friends and family complaining about the snow on their streets!”

When Mayor Ben Walsh took office in 2018, he was determined to take a new data-driven approach to tackle persistent problems facing Syracuse residents. Whatever the problem in Syracuse today, a first step toward designing a solution is to dig into data. “You can’t fix what you don’t fully understand,” Mayor Walsh said in his 2019 State of the City address. Data helps the City understand the causes of problems and address them, he added.

With clear support from the Mayor’s Office, city staff have worked in recent years to build foundational data practices including general management, performance & analytics, and open data to improve the delivery of city services like snow removal. The aim is to deliver efficient, effective, and equitable services — a goal that has become core to Walsh’s administration.

“We’re not data-driven for the sake of being data-driven. Data empowers us to know if we’re being effective or not, and then pivot when we need to change.”

Syracuse Mayor Ben Walsh

Deputy Mayor Sharon Owens admits she was once a “data nonbeliever.” Now she has the passion of a convert. “Being able to use data to hone in on quality-of-life issues is crucial,” Owens says. “We spend too much time sending out a wide net when we should be honing in. Residents are impacted by our ability to take data and use it to solve the problems they care about.”

Plowing Through Data

The Parks Department and DPW’s effort to overhaul how they prioritize clearing snow from roads and sidewalks shows how data can translate into better and more transparent city services.

During snow events, the DPW snow plows move into action. The department follows a system of prioritizing city streets for snow removal: the first priority is always emergency routes, followed by hills around the city and roads with significantly higher levels of traffic. Flatter city streets generally found in residential neighborhoods come next.

Clearing the City’s streets after a snowfall. Image courtesy of the City of Syracuse.

The City compiled data from GPS units in each snowplow to create and publish an interactive map on the City website, enabling residents and property owners to track the path of snowplows during storms to determine if a street was already plowed. The map includes timestamps of a plow’s most recent pass of a street. The data also equipped the DPW staff to more quickly and accurately identify any streets a snowplow may have missed on its run.

To improve sidewalk snow clearance, the City took a similar approach. Working with the Syracuse Metropolitan Transportation Council, a team of DPW staff members and transportation planners first mapped foot traffic, building a dataset detailing which sidewalks are used most frequently and which are adjacent to the most dangerous streets. Again, data analysis showed the obvious snow removal strategy.

“We determined the most dangerous streets for pedestrians and cleared sidewalks in those areas first. Using data, we were able to make and defend decisions about why we chose to clear certain streets and sidewalks over others.”

Chief Operating Officer Corey Dunham
Image courtesy of the City of Syracuse.

The Department of Parks, Recreation and Youth Programs also dug into data to improve its approach to snow removal. The first step was mapping all the sidewalks and walkways in Syracuse’s 164 parks it is responsible for — 13 miles total, the department learned. Previously it would take three days after a major snow event to clear all sidewalks and walkways. After creating a color-coded map making priority routes clear — and buying two Bobcat L28 machines enabling a sidewalk to be cleared in just one pass — the department now clears them in just six hours.

Syracuse officials have also used more data-driven budgeting practices to save money on road de-icing materials. Previously, each department across the city was managing its own financials and budgeting from budget-to-budget, instead of actuals-to-budget. By centralizing the budget planning process and providing actuals to departments, Syracuse was able to make better spending decisions. This approach allowed DPW to analyze data for how much salt it purchased each year for de-icing and how much salt it actually used. The ultimate outcome: officials were able to better predict how much salt they needed to buy. Last year, the data-driven effort helped the city save an estimated $800,000 on salt purchases.

More Results to Come

Syracuse’s efforts to strengthen its data culture and practices have yielded benefits beyond snow removal. The City has also used data-driven problem-solving skills to address more complex challenges, such as poverty, inequities highlighted by the COVID-19 pandemic, and neighborhood revitalization efforts.

Looking ahead, exciting things are in the works — all fueled by the data capacity Syracuse has built. Later this month, the City plans on unveiling a brand-new resident information system revamping its city service request system into a more comprehensive and user-friendly portal.

And by the end of the year, Syracuse will build the first 25 of 200 one- and two-family housing units through the new Resurgent Neighborhood Initiative (RNI). The program supports city neighborhood planning and revitalization at the block level. Affordable housing construction locations were chosen by analyzing quantitative data detailing the locations of vacant and unused properties, and gathering qualitative data through 800 resident interviews conducted over eight months. This stakeholder engagement helps ensure equity, so the City can better deliver on the promise of affordable housing.

“Whether the challenge is housing, a pandemic, or snow removal, being a data-driven city means efficiently, effectively, and equitably delivering services that taxpayers pay for,” Mayor Walsh says. “This is the nuts and bolts of local government.”

Join Our Certified Cities!

Disclaimer