Dallas, Texas, USA
An All-In Approach to More Inclusive Budget Decisions
Project Type:
Community Engagement, Environment, Health and Wellbeing, Transportation
At a Glance
Used disaggregated data to drive budget decisions that address inequities based on race and/or income. All 42 city departments contributed to the establishment of over 220 metrics that are tracked publicly through the Racial Equity Plan, of which $40 million was allocated towards equity investments.
Launched the first Spanish-language 311 mobile app of any big city in Texas.
Reduced the number of steps in the procurement process from 82 to 23, speeding up the time it takes the city to purchase goods and services.
City leaders in Dallas know that if you want to get something done in local government, the budget is a good place to start. So when they took on the goal of creating a more equitable city, that’s exactly what they did.
The result is a process Dallas calls Budgeting for Equity. Rooted in sophisticated data practices, it’s one of the most robust City Hall systems in place anywhere for identifying and addressing disparities.
The effort began in 2019, with publication of the Dallas Equity Indicators report. The report measured equity across 60 social and economic indicators, from business ownership to home loan denials to kindergarten readiness. It also provided baseline data for local leaders to track citywide equity changes over time.
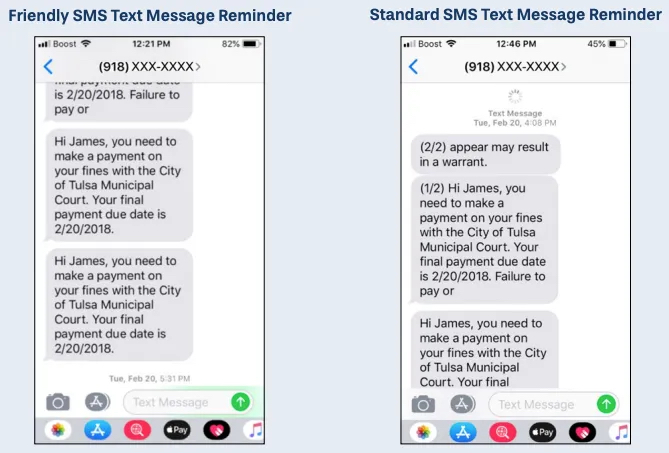
Next, eight departments used the equity indicators to identify disparities and change budgets to address them. For example, the 311 customer service center noticed that wait times were longer for Spanish-speaking residents. In response, the department hired bilingual staff and recently became the first big city in Texas to launch a Spanish-language 311 mobile app.
Budgeting for Equity has since expanded across all of city government. It’s led by the Office of Equity & Inclusion –in collaboration with the Office of Budget Management Services which guides the City’s 42 departments as they use a tool the Office created to help them prioritize equity in their budgets. Departments are required to use disaggregated data so they can spot disparities within the services they provide by race, ethnicity, age and other factors. They also must consider how their budgets may produce both positive and negative impacts in communities of color and lower-income neighborhoods.
“It’s easy to talk about the ways we’re helping people,” says Dr. Lindsey Wilson, Dallas’ Director of Equity & Inclusion. “But how are we also burdening communities? We need to not only talk about the good things but also the not-so-good things that data is telling us.”
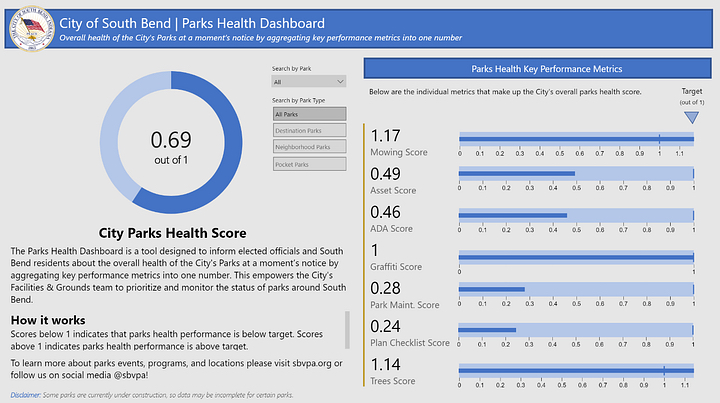
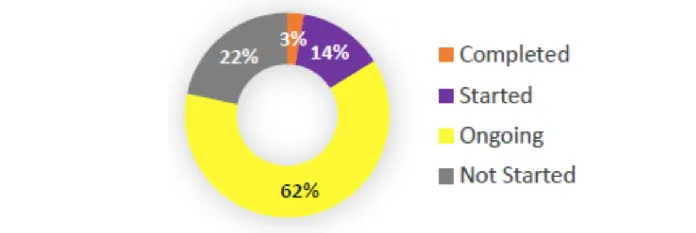
What makes Dallas’ efforts stand out from what other cities are doing is its thoroughness. Budgeting for Equity is not an occasional activity for a handful of departments at a time — in Dallas, every department does it every year. The process is aligned with a comprehensive Racial Equity Plan the City Council adopted in 2022, which includes a set of “Big Audacious Goals” meant to guide implementation of that plan; progress is continually tracked in a public dashboard. Individual departments in charge of libraries, arts and culture, planning, and water, have earned recognition from their own industry organizations.
“Each year we hear from departments about adjustments we need to make,” Dr. Wilson says, noting that the number of questions departments are asked to answer through Budgeting for Equity has been reduced from ten to five to reduce burdens on them. “The one thing that never changed was the use of data to drive the outcomes.”
60 citywide measures included in Dallas’ Equity Indicators Report
3,203 individuals and 284 organizations were directly engaged in creation of the Racial Equity Plan.
5 “Big Audacious Goals” in the Racial Equity Plan
“If we continue to strengthen and hold ourselves accountable for this work, we should see disparities decrease and begin to see transformative change.”