Calgary, Canada

Make it Personal: How Calgary Is Supporting Residents to Take Climate Action.

Project Type:
Energy, Environment, Infrastructure and Utilities, Technology

At a Glance


The residential solar calculator helps Calgarians understand the potential for solar energy generation in their home. It provides an estimate of energy cost savings, greenhouse gas reductions and the investment payback period. This data supports Calgarians to make informed decisions on energy use in their home.


Applied advanced analytics to map data, 3D building models and energy costs to create a residential solar calculator tailored for Calgary households—an in-house solution that contributed to a doubling of the city’s residential solar installations in 2023.


48,000 visits to the online residential solar calculator, with 65% returning users, which shows high engagement from residents.

The importance of harnessing the power of the sun is clear. Worldwide, extreme weather events have increased fivefold since 1970 and 2024 was Canada’s costliest year on record for weather-related disasters. Calgary, Canada’s sunniest city, enjoying approximately 333 days of sun each year, and Canada’s fastest-growing metropolitan area with 1.68 million residents, recognizes that addressing climate change requires collective action. For individuals, it can be hard to know how to contribute. But The City of Calgary is empowering residents to act with a climate strategy that blends data, innovation and community engagement.

One standout initiative is Calgary’s Residential Solar Calculator. Launched in 2022, the online tool allows homeowners to assess their property’s solar potential. It uses LiDAR remote sensing and GIS mapping technology to account for roof tilt, orientation and shading and provides personalized solar insights for each Calgary residential address. The tool equips residents with vital knowledge to weigh the pros and cons of solar energy and engage with service providers confidently. The calculator educates homeowners on switching to solar energy, providing an estimated upfront cost and monthly energy savings. This information is crucial for determining whether solar energy is financially viable and how quickly the investment will pay off.

Calgary’s Residential Solar Calculator dashboard.

“Data analysis, visualization and data-supported stories play an incredibly important role in our climate work today and the climate work of tomorrow. We are using data to help us understand the complex nature of climate systems, identify patterns and trends, inform action and communicate with Calgarians.”

Dawn Smith, Manager, Governance & Reporting, Climate & Environment

To support Calgary’s broader greenhouse gas reduction goals, The City wants to generate more of its electricity needs within city boundaries from renewable sources. In 2023 alone, Calgary installed 16,000 kilowatts of residential solar PV—doubling the city’s capacity. During this time, more than 48,000 people have visited the calculator and almost two-thirds are return users, signaling high engagement. The popularity of the calculator highlights that there is an appetite from Calgarians to explore and understand the benefits of installing solar energy in their homes. By providing easily accessible, relevant and tailored information to homeowners, the residential solar calculator helps drive solar adoption indirectly through education and information sharing.

Supporting these efforts is Calgary’s comprehensive climate and environment dashboard, which tracks metrics and shares key program information with residents. This dashboard will ensure The City is transparent and accountable to its climate goals and outcomes by providing a comprehensive resource for the community to monitor results.

“Calgary is committed to embedding data and evidence into our decision-making processes. This approach ensures that taxpayer dollars are used effectively and that Calgary is a stronger and more resilient city, capable of facing future challenges.”

Mayor Jyoti Gondek

Climate change is a global challenge, but Calgary’s approach shows the power of solutions that involve government and residents. By making climate information more personalized and accessible to all, Calgary is not only addressing the crisis—it’s demonstrating its commitment to support its residents and setting a benchmark for other cities.

Calgary’s Climate and Environment dashboard.

Join Our Certified Cities!

Burlington, Vermont, USA

A Data-Driven Approach to Building More Housing

Project Type:
Community Engagement, Economic Development, Housing

At a Glance


Passed data-driven zoning changes that are boosting the amount of housing that can be built in neighborhoods across the city.


Used disaggregated data and community outreach to design a small business loan program that complies with Sharia law, allowing Muslim residents to more easily start businesses.


Novel approaches to opioid response have grown out of regular CommunityStat meetings where elected leaders, community members and subject-matter experts review overdose data and collaborate on responses.

In Burlington, a city of 45,000 on the shore of Lake Champlain, one of the biggest challenges today is the same problem that cities 10 and 20 times its size are wrestling with: How can we build enough housing to bring down the skyrocketing cost of living?

To answer this question, Burlington looked at one common obstacle for housing supply: zoning laws. City leaders started by assembling data to understand the existing state of the local homeowner and rental markets, and how those have changed over time. The resulting Housing Report set the stage for extensive resident engagement (including housing trivia) and public debate around housing needs. It also showed clearly that the city would not meet its goal of building 1,250 new housing units over five years without trying new approaches.

1,124 number of units built or in construction and permitting pipeline as of June 2024

“We’ve used data to inform this [zoning amendment] process, and we’re tracking and evaluating the work that we’ve done.”

Sarah Morgan, Planner, City of Burlington

Another analysis produced data on the character and typologies of different neighborhoods in the city and what zoning does and does not control. Both datasets informed the text of the final zoning amendment approved by the City Council, which aimed to be sensitive to the existing context of residential neighborhoods while offering the flexibility necessary to encourage construction of more housing types.

The end result is the city’s new Neighborhood Code, launched in 2024. The plan changes zoning in every neighborhood in the city to allow more multi-family dwellings to be built. This upzoning solution aims to solve the problem of “missing middle housing”, which are multi-unit properties such as townhomes, duplexes, triplexes and  cottage clusters, that fill the gap between single-family homes and large apartment buildings. It offers residents more options based on their budget and increases Burlington’s housing supply. Where similar proposals in other cities around the country have proven controversial, Burlington’s City Council passed the plan unanimously.

40 number of units permitted in the first eight months of the new Neighborhood Code.

There are early signs that the code changes are making a difference. Since March 2024, 40 new housing units were permitted under the new code – well more than the 10 per year city planners expected. That alone won’t fix Burlington’s housing supply problems. But over time, the Neighborhood Code stands to play an important role in how the city meets its housing goals, which are tracked real time on a public-facing Housing Dashboard. “There is evidence in other cities that real increases in housing supply have led to lower rents,” says Nancy Stetson, Senior Policy and Data Analyst. “We want to be able to show that in Burlington, too.”

“Being a What Works Cities Certified city affirms the direction we’re on as a city that’s going to innovate around problems we face and also let the vibrancy of Burlington reemerge.”

Mayor Emma Mulvaney-Stanak

Join Our Certified Cities!

Oklahoma City, Oklahoma, USA

Using Evidence to Improve Emergency Medical Care

Project Type:
Health and Wellbeing, Homelessness, Housing

At a Glance


The City of Oklahoma City became the lead for the Key to Home Partnership — a collaboration of over 50 organizations working to prevent and end homelessness — and successfully housed 1,610 individuals in 2024.


Developed an evidence-based emergency response strategy, providing nearly 100 trauma patients with life-saving blood transfusions in the field before they get to the hospital.


Launched an innovation team, which leads data governance efforts and partners with the “Leading With Results” performance management team to continually monitor, evaluate and improve City operations.


Formed a data governance board to engage city departments in finding ways to make data more shareable, secure and useful in decision making.

In January 2024, two Oklahoma City paramedics found themselves 120 miles from a hospital tending to a man who had been crushed by a bulldozer. They did something unusual in civilian trauma cases: They administered a blood transfusion in the field. The man survived the two-hour trip to the hospital, where he received additional treatment.

The idea of transfusing a patient in the field may not sound revolutionary, but it actually flips traditional protocols upside down. For years, the status quo in these trauma cases has been the same: Blood transfusions happen in the hospital, and the paramedics’ goal is to get to the hospital as fast as possible.

In Oklahoma City, paramedics with the Fire Department had an idea: What if instead of transporting the patient to the blood, they brought blood to the patient? It might buy trauma patients valuable time to make it to the hospital alive.

Image Courtesy of the City of Oklahoma.

Rather than immediately launching a new program, Fire Department leaders started by looking at experiences of other cities. They reviewed the research on emerging practices and found evidence that the approach would save lives. Not only that, but their peers in San Antonio had started a groundbreaking program just like this in 2018. It was working so well it had become a national model.

Backed with hard evidence, Oklahoma City leaders built their new program. Two Fire Department emergency units carry mobile transfusion kits that include bags of refrigerated blood and a device that quickly warms the blood to body temperature. Paramedics are now able to transfuse patients in the field, ahead of additional care at the hospital. As Carl Cobb, Battalion Chief of Emergency Medical Services for the Oklahoma City Fire Department, puts it, “It helps the paramedics or EMTs that are providing care know that they are giving them the best chance of survival.”

“Our data governance board is an important piece of breaking down silos between departments, and it couldn’t happen without leadership support. It makes sure that departments know it’s not just that we want to measure stuff but that we want to make sure the measures are correct, easy to access, and actionable.”

Dr. Kelly Williams, Chief Innovation Officer

“The way our data governance board approaches issues is not about one department being better than another. It’s about all of us being good together.”

City Manager Craig Freeman
Oklahoma City paramedics prepare a blood transfusion on the scene.

1,610 individuals successfully housed in 2024

Now, it’s making a big difference for Oklahoma City residents. Through the program, OKCFD and EMSA paramedics have administered whole blood to more than 90 patients in the field. Of those the Fire Department responded to, 89 percent survived the trip to the hospital. And 69 percent of them survived to hospital discharge.

The Oklahoma City program is a partnership among the Fire Department, Oklahoma University Health, EMSA, Our Blood Institute, the regional blood bank and more. The partners meet to review every case where whole blood is used to assess how the program is working. They’ve already made some tweaks based on their ongoing evaluations. For example, at first, only male patients aged 15 and up, and females over age 50 were eligible — there were concerns about risks of reactions to O-positive blood among women of childbearing age. Now, all patients aged 15 and up are eligible, and the partners are looking at whether the age limit can be lowered to 6.

Paramedics say the new program, grounded from the start in evidence that it would work, is a game-changer. “I’ve been working for 30 years,” says Oklahoma City paramedic Jennifer Hamilton. “No changes have made more impact in my work than the whole blood program.”

“Achieving What Works Cities Certification is more than just validation of the work we’ve been doing with data. More importantly, it sets us on a path where we can grow and get even better.”

City Manager Craig Freeman

Join Our Certified Cities!

Rio de Janeiro, Brazil

A Bridge for the City’s Most Vulnerable

Project Type:
Community Engagement, Housing, Infrastructure

At a Glance


266,393 household surveys were carried out by the City’s Social Territories program to identify vulnerable families disconnected from municipal services.


3,758 out-of-school children and adolescents aged 4 to 14 were referred for enrollment.


9,744 families living in extreme poverty gained access to housing, healthcare and other social assistance through the Social Territories program.

About 2 million of Rio de Janeiro’s 6.2 million inhabitants live in favelas, residential areas spread across the City of Rio. These densely populated neighborhoods are often hard to reach, lack infrastructure and many families remain without access to basic services, disconnected from the sewage network, running water or electricity.

The first step to helping these families is to find them, as many of these residents are not part of government systems and there is little data about them. Thus, Rio City Hall decided to launch a new program, Social Territories, in partnership with UN-Habitat, the United Nations’ sustainable urban development program. With field agents who go door to door to interview families, the program’s priorities are to identify families at social risk and provide them with various basic public services, such as school enrollment, health care, referral to social benefits, housing support, and access to professional training and job opportunities. For example, Social Territories data helps the City choose beneficiaries of Casa Carioca, a housing requalification program.

Designed in 2016, Social Territories has proven the value of a three-phase, data-driven approach to helping some of Rio de Janeiro’s most vulnerable residents.

Image courtesy of the City of Rio de Janeiro.

In the first phase, municipal officials conduct interviews with residents to identify how they could help, whether by enrolling children in school, providing clean water or other support. Detailed household survey data is analyzed against standards defined in the UN Multidimensional Poverty Index. Levels of risk are established to indicate the degree of need of each household, which lays the groundwork for the second phase of the program. Using survey and geospatial data, municipal departments reach out to high-risk families, including those living in extreme poverty, to provide appropriate services such as housing, health care, education and job training. The final phase of Social Territories involves monitoring residents receiving targeted services and then reassessing their needs after a year.

In essence, the program aims to proactively learn about disconnected communities and build bridges between the City and residents to improve their lives. Administered by the Pereira Passos Institute, which oversees the City’s data practices and uses detailed demographic data to support the implementation of policies and programs, the Social Territories program has expanded over the years. Originally focused on 10 favelas, in 2022 the program expanded to cover all of Rio de Janeiro. That same year, it was recognized with a World Smart Cities Award.

“The Social Territories program serves all areas of City planning, identifying vulnerable families and increasingly promoting equity in access to services and opportunities.”

Bianca Medina, Coordinator of Social Territories at Instituto Pereira Passos

Today, Social Territories continues to show what can happen when a municipal government prioritizes data-driven decision-making to help its most vulnerable residents. In January 2025,

  • Almost 32,000 families identified by the program were served by the Municipal Health Department
  • Nearly 26,000 were served by Municipal Secretariat of Social Assistance
  • Almost 8,000 families received housing improvements, many of them through Casa Carioca Project
  • Nearly 4,000 children were recently enrolled in school
Image courtesy of the City of Rio de Janeiro.

“With the data made available by the Pereira Passos Institute from the field search, we can provide secretariats with information about families, improve the living conditions of the population, improve the efficiency of public management and promote sustainable urban development. It is an immense satisfaction to see the program happen and take shape in Rio.”, says Eduardo Paes, Mayor of Rio de Janeiro.

“When data drives our city’s services, we not only deliver results for our community, but we also rebuild trust with residents. What Works Cities Certification shows residents that we are making smart decisions that they can see and understand, making them partners in improving our city.”

Eduardo Paes, Mayor of Rio de Janeiro
Image courtesy of the City of Rio de Janeiro.

“Using data and evidence to run local government is more efficient. When you know where to invest and where the results come from, you save money.”

Lucas Padilha, Municipal Secretary of Culture
Join Our Certified Cities!

Sugar Land, Texas, USA

Where Data and Curb Appeal Aim to Make a Stronger City

Project Type:
Community Engagement, Equity, Health and Wellbeing, Technology

At a Glance


Used the Neighborhood Health Report, which included GIS data on population stagnation, aging housing and code violations, to create a home renovation program which targeted investments of over $2.7 million to upgrade 166 Sugar Land homes (145 projects have been completed.)


95% of participants said the program significantly influenced their decision to renovate their homes.


Redevelopment is one of the city’s “All-In” Initiatives using cross-departmental collaboration and performance management to make progress on complex challenges.


Another All-In Initiative is to increase the City’s data-driven decision making and is led by a four-person “What Works Cities team”

Neighborhood blight is not something you hear much about in Sugar Land, a prosperous suburb that frequently ranks near the top of “best places to live” lists. And city leaders want to keep it that way.

But here’s the challenge: The first wave of subdivisions that began Sugar Land’s transformation from small town into a city of 110,000 are reaching middle age. Some of the homes built in the 1970s and ‘80s are starting to look rough around the edges. Property values are linked to a city’s economic health. Declining property values can discourage community investment, reduce revenue for the City and make it hard to attract new residents. 

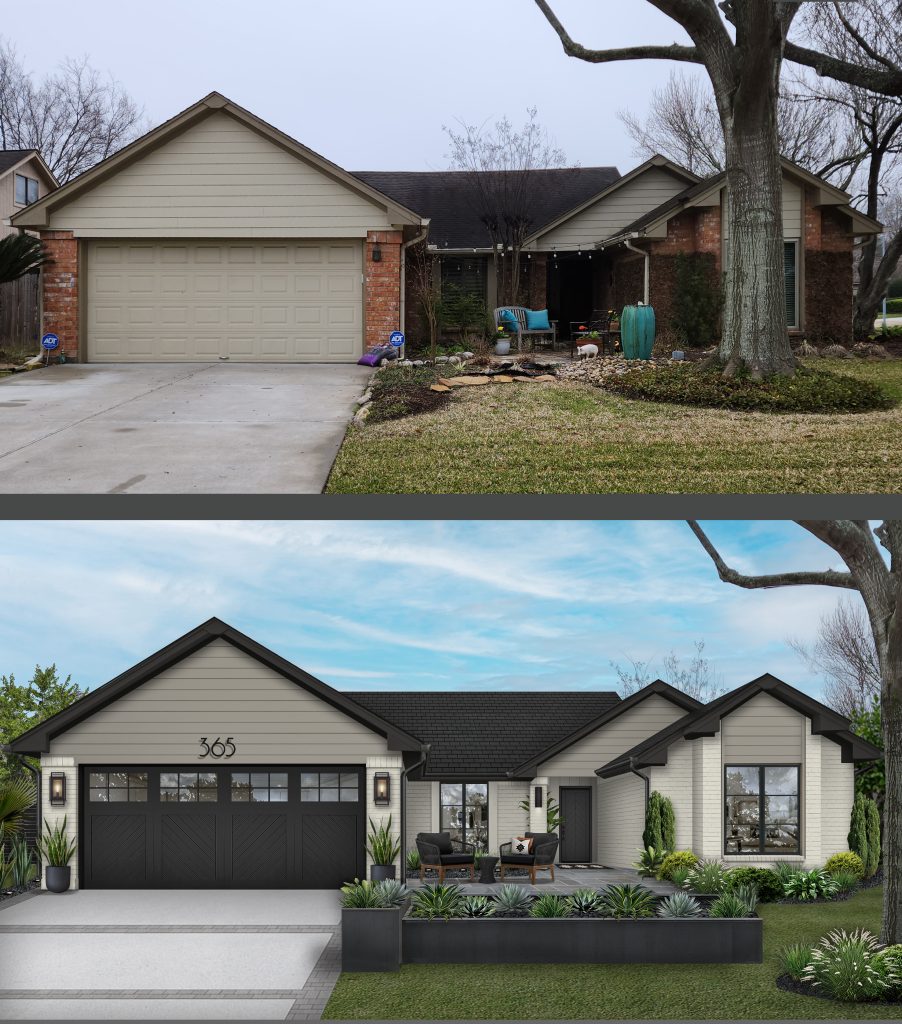
In response, Sugar Land recently launched a successful program called Great Homes Update. It encourages homeowners to take on external home upgrades like painting, garage door replacement, or driveway repairs. And it’s built from top to bottom on data that city leaders used to understand the problem, rally political support, and devise a solution that meets residents’ needs.

Great Homes is one product of what Sugar Land leaders call their “All-In” initiatives. These are cross-departmental collaborations aimed at using a performance management approach to make progress on complex challenges. Redevelopment in a mostly built-out city is one of those All-In initiatives. Improving data-driven decision making through What Works Cities coaching is another. 

To start, leaders conducted a neighborhood health report, mapping the age of homes across the city and where the most code violations were happening. They also sent staff out to different neighborhoods to do a qualitative assessment of the conditions of homes’ roofs, fences, and driveways. 

Next, they surveyed residents to make sure they understood the problem from the homeowners’ perspective. Residents confirmed that they would, indeed, implement improvements if a financial incentive were available. Before designing a pilot program, city leaders looked at how home-improvement programs work in 22 communities across the U.S. Their efforts to find evidence-based solutions in other cities paid off: The pilot they devised won nearly unanimous support from the City Council in February of 2023.

An example of the potential impact of exterior home renovations supported by the Great Homes program. Images Courtesy of the City of Sugar Land.

Through the program, owners of single-family homes are reimbursed for a portion of the cost of exterior house repairs, up to a maximum of $10,000. The City gave a higher rebate percentage to older homes and homes with less than the county’s median home value. .Another program offers owners of single-family houses and homeowner associations discounts on home design services. To make it easy for residents to find out exactly what benefits they’re eligible for, the City developed an easy-to-use address lookup tool based on resident feedback. 

Results from the first year of Great Homes were impressive. Homeowners carried out more than 145 home projects, including house painting, repairs to roofs and siding, and landscaping. The total of all repairs incentivized through the program was $2.3 million, with about $500,000 of that coming from city coffers. In follow-up surveys, users of the program overwhelmingly agreed that the City’s reimbursements influenced their decision to make home repairs. 

City leaders continue to use data to evaluate and improve Great Homes. Under a new iteration of the program, the list of eligible projects has expanded to include front door and gutter replacement.

In the long run, Sugar Land hopes the program will help make the City competitive with nearby areas and deter decline, helping to sustain a prosperous Sugar Land.

“What Works Cities Certification gives our organization a beacon to show: This is where we’re going and this is how we’re going to do it. We don’t need to create our own playbook.”

Mike Goodrum, City Manager
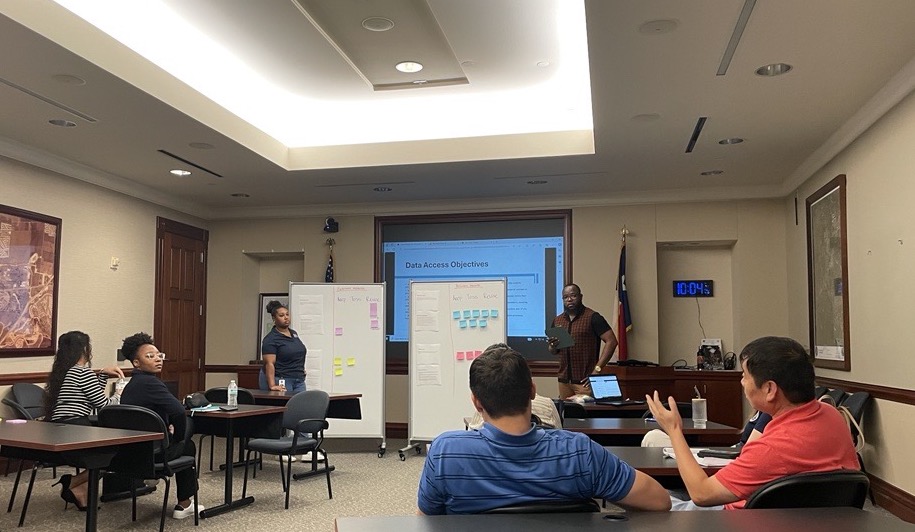
A data strategy brainstorming meeting. Image Courtesy of the City of Sugar Land.

“It’s a community effort that the program is inspiring. Keeping our neighborhoods in good shape is very important for the community.”

Joel Sanchez, Sugar Land resident and Great Homes participant

Residents leveraged about $500,000 in City funds to make more than $2.3 million worth of home improvements.

Join Our Certified Cities!

Luján de Cuyo, Argentina

Bajo Luján’s Journey to New Housing.

Project Type:
Community Engagement, Environment, Equity, Health and Wellbeing, Infrastructure, Public Safety, Technology, Transportation

At a Glance


Relocated more than 1200 families who lived in flood-prone areas.


Created a workforce development initiative that employed residents, renovated public land and expanded access to recycling centers.


Improved access to territorial data, which made getting land permit data faster—going from months of waiting to just three clicks. The platform, Luján 3D, allows renovations and housing development to have substantial improvements.


Improved accessibility for residents with disabilities through an adapted bicycle program.

In 2016, a survey conducted by the city of Luján de Cuyo, Argentina, revealed a heartbreaking reality. There were about 3,500 families who lived in marginal or informal neighborhoods, of which 700 were concentrated in the Bajo Luján area, often without basic services. The most vulnerable residents lived near a flood-prone river, underscoring the urgency for change. As a result, the City developed an ambitious urbanization and relocation project, supported by the World Bank.

At the heart of the initiative was a resident-driven approach. Residents were surveyed to identify and prioritize needs, including proximity to employment, family size, and level of need to minimize disruption to their daily lives. Efforts to monitor the impact of this relocation were key. A survey and audit process was initiated, capturing residents’ experiences before, during and after the move. This data was visualized through PowerBI dashboards, allowing real-time tracking of project progress.

“Governing is making decisions. Doing it well requires exceptional use of data. If we intend to achieve real impact in the community, our public policies must be data-driven. We dream of becoming an international example of well-managed local government.”

Esteban Allasino, Mayor

The result was the construction of 700 homes in 11 neighborhoods.

This enormous initiative not only provided new homes, but restored a sense of human dignity and trust in government for those who had long been marginalized.

Seven hundred safe and practical homes is a significant achievement.

Additionally, the community intervened and regularized other settlements benefiting 500 families, completing a very ambitious stage that managed to reach more than 35% of the most vulnerable sector of the City.

But the government did not stop there. City leaders knew that housing is only one part of poverty. Thus, in an effort to create employment opportunities, the city turned its attention to residents who worked at the landfills as urban recyclers.

These families made a living collecting recyclable materials from garbage dumps. To help them, the following public policies were promoted: Closure and remediation of garbage dumps, Social inclusion of urban reclaimers, Inclusive Recycling Program – Centro Verde. In this way, the city, together with a group of neighbors, mainly women, officially formed a cooperative. The City provided land and necessary infrastructure.

The Fortress of My Earth, which now has nearly 30 members, launched a program that uses geographic information system (GIS) data to strategically place recycling bins throughout the city. This project successfully increased the number of Green Dots from 8 to 65, ensuring that residents could easily find a container within 500 meters of their homes. This caused a notable increase in recycling from 2021 to 2023.

The story doesn’t end there. In 2021, the City cut the ribbon on Luján Park,  located in the previously abandoned housing settlement Bajo Luján. The area has been transformed into a lively community space, with children’s play areas with equipment made from recycled plastic from the cooperative.

The Bajo Luján and Centro Verde projects reveal how intertwined initiatives can have an exponential impact on residents’ lives. They boosted citywide sustainability, helping hundreds of Luján de Cuyo residents achieve housing stability and financial independence and building much-needed trust in local government.

Join Our Certified Cities!

Alexandria, Virginia, USA

Data & Community Partnerships Key to Addressing Evictions in Alexandria

Project Type:
Community Engagement, Equity, Housing

At a Glance


Developed an automated system for gathering information on eviction court proceedings. The data informs the efforts of the Eviction Prevention Task Force, a City-community partnership that supports households at risk of eviction.


Since the CDC moratorium ended in August 2021 to the end of 2023, 7,968 evictions have been filed in Alexandria. With support provided by the Task Force and other community partners, only 1,018 of those evictions resulted in a resident being removed from their home.


An independent evaluation of the Alexandria Co-Response Program (ACORP) found that when its teams of trained law enforcement officers and behavioral health clinicians responded to 911 calls that could have resulted in arrests, 70% were diverted from legal action.


Launched an Equity Index Map in 2023 to identify disparities in key social and economic outcomes and to help city staff and community partners make equitable, inclusive and data-driven decisions.


Maintains 92 datasets and dashboards that track how well City programs are working, provide transparency to the community, and help inform collaborations with residents and stakeholders.

Housing affordability has been a priority and a work in-progress for the City of Alexandria for over a decade. Even before the economic volatility of the pandemic, 89% of renters earning $50,000 or less were housing cost burdened and paying over 30% of their incomes in rent. When the pandemic hit, many of these households had little financial buffer.

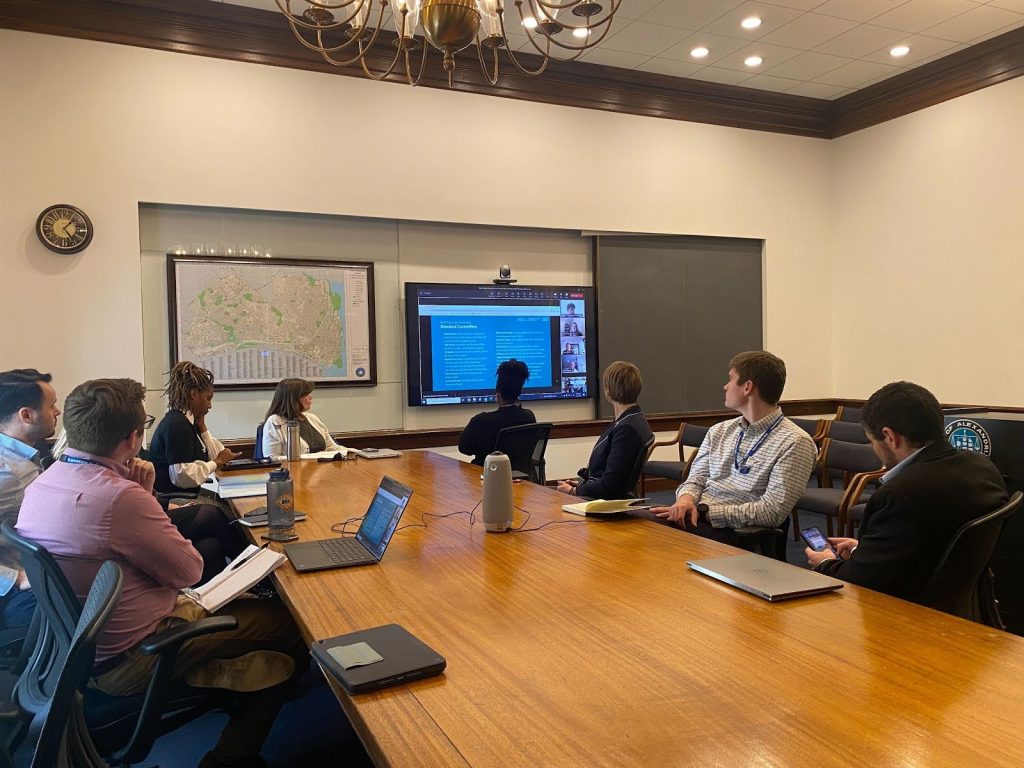
Hoping to stem a tide of evictions, legal and housing advocates across the city jumped into action. Rather than duplicate the work of local organizations, in June 2020, the City formed an Eviction Prevention Task Force to bring together local nonprofits, faith organizations, and City departments to share information and coordinate efforts.

“We have boots on the ground. We are triaging emergencies. This partnership with the City and faith-based community and nonprofits is unique to Alexandria,” Mary Horner, a housing attorney for Legal Services of Northern Virginia, said in July 2020. “It is the benefit of our size and our tight-knit community. Everyone is on the same team.”

One strength, in particular, the City brought to the partnership was in data collection and analytics. Legal Services of Northern Virginia had been collecting publicly available data on eviction proceedings from the Alexandria General District Court to guide outreach efforts to at-risk households – but that data collection was taking hours each week. The City’s Office of Performance Analytics (OPA) used funding from the American Rescue Plan Act to hire a data analyst to work with the Task Force. The analyst assessed the situation, built a web scraper that reduced the weekly data collection process to a few minutes, and developed a dashboard to follow trends and changes in the eviction landscape.

“We have boots on the ground. We are triaging emergencies. This partnership with the City and faith-based community and nonprofits is unique to Alexandria. It is the benefit of our size and our tight knit community. Everyone is on the same team.”

Mary Horner, Housing Justice Senior Staff Attorney, Legal Services of Northern Virginia

Coordinated, data-based outreach efforts by Task Force partners paired with state and local rental assistance proved incredibly effective in preventing evictions. Between June 2020 and September 2021, City departments helped 3,717 households secure city and state rental assistance.  In 2021, control of rental relief funds transitioned from local government to state government. From January 2021 to December 2023, Legal Services of Northern Virginia – with financial support from the City – provided legal assistance to over 3,500 people through courthouse outreach, representing 17% of tenants facing eviction.

The Task Force’s role has evolved with the changing eviction landscape. Pandemic-era federal and state eviction moratoriums and rental assistance programs have ended, yet evictions legally served to tenants are still below pre-pandemic levels. But the approach of using data and partnerships to improve housing stability is still producing positive outcomes. For example, when a state rental assistance program ended in 2022, a local church asked how much it would cost to stop evictions for the remainder of the year. Using data on the average amount of unpaid rent, the Task Force could answer and the church donated the money.

The City of Alexandria’s strong data foundation and investment in staff capacity made it a productive partner in the Eviction Prevention Task Force, helped bring housing stability to thousands of residents during the pandemic, and are informing the City’s ongoing efforts towards increasing housing affordability.

“The [Eviction Prevention] Task Force has done an impressive amount of work and, as you can see in the numbers, it’s making results. During the pandemic I saw a report that suggested that Virginia had the highest rate of any of the states in allocating federal rental assistance funds. That’s impressive for the entire commonwealth, but I would argue that it’s our efforts in Alexandria that probably made most of that happen.”

Mayor Justin Wilson

Join Our Certified Cities!

Charleston, South Carolina, USA

Creating a One-Stop-Shop to Track Progress on City Goals.

Project Type:
Community Engagement, Environment, Equity, Housing, Infrastructure, Public Safety, Technology

At a Glance


Charleston’s TIDEeye app helps the city and its residents monitor the effects of severe weather by providing real-time data on road closures and weather information.


Charleston has added almost 800 affordable housing units since 2016, and 500 more currently in the pipeline.


Data has shown that 86% of the affordable housing units in development are within .5 miles of public transit.


Known as a tourist destination with idyllic horse-drawn carriages, the City optimized equine waste management with GPS tracking. The system helped reduce cleanup time from 40 minutes to 20 minutes.


Using outcomes-based performance management practices to understand if programs are achieving their intended impact.

For cities with competing priorities and limited resources, making city-wide strategic goals built on data and evidence is an achievement in itself. But tracking progress, engaging residents and strengthening accountability is a tougher feat.

In 2022, the City of Charleston outlined six mayoral priorities and launched PriorityStat, an online dashboard and public meeting series to increase transparency and help the City and residents track progress on these six goals. While traditional city open data dashboards are organized around departments or services, PriorityStat takes a more innovative approach and is centered on City—and residents’—priorities.

For instance, FloodStat, one of the dashboards, is focused on protecting the City from sea level rise and flooding. In the 1950s, Charleston was impacted two  days per year on average by nuisance flooding. In the past five years, that average is now 61 days per year. Traditional dashboards would have relevant metrics, such as police complaints about flooded roads and properties, and city carbon emissions, in different dashboards since they’re in different departments. But addressing flooding and coastal challenges requires many departments to effectively work together. FloodStat helps break down silos by developing and regularly tracking metrics that require cross-agency collaboration. Additionally, it gives residents one place to see a more complete and clear picture of how the City is combatting its challenges.

Another one of the mayoral priorities is affordable housing. Home prices have jumped 78% since 2011 in Charleston—an unsurprising trend for a City with a 25% population increase since 2010 and more than 7 million visitors each year.

HousingStat allowed Charleston officials to develop a 10-year comprehensive plan to improve housing. To eliminate affordability gaps by 2030, the City learned that it needs more than 16,000 affordable units. HousingStat has also led to new programs, such as a Senior Homeowner Initiative, that has already helped 18 seniors become first-time homeowners. Regularly disaggregated data has helped the City allocate resources where they are needed most and develop more targeted strategies.

“We’ve been able to cut red tape on affordable housing initiatives. This is the largest, most ambitious affordable and workforce housing initiative in our city’s history.”

John Tecklenburg, Mayor

The City is clear that PriorityStat is still a work in progress. Two more dashboards are on the docket for 2024: one for mobility and transportation, and the other for neighborhood livability and resident quality of life. While these are being built, the City is actively seeking feedback and encouraging residents to watch public meetings on Charleston’s YouTube page.

PriorityStat is a performance management grand slam for the City. But more importantly it’s a win for residents. An unwieldy and unorganized performance management dashboard isn’t a platform that performs for residents. Charleston’s PriorityStat is different: by embedding accountability, transparency and collaboration into the fabric of the City’s strategic goals, residents know the City is making strides with them in mind.

Join Our Certified Cities!

Tulsa, Oklahoma, USA

Tulsa Scales Up Data-First Innovation.

Project Type:
Communications, Cross-Sector, Economic Development

Tulsa most recently achieved 2024 Silver What Works Cities Certification. The following narrative was written for Tulsa’s 2020 Silver What Works Cities Certification. Some content may be outdated. For the most current information, please visit cityoftulsa.org.

At a Glance


Created a cross-departmental team that identifies the most effective methods for achieving the city’s top goals and leads the city’s data-driven transformation.


Found patterns in 911 repeat call data that signaled the need for a new referral program to deliver specialized healthcare and social services for residents. Within the first three months of launching the program, there was a 70% reduction in calls from its top 911 utilizers.


Partnered city agencies and civic tech nonprofits to develop a text reminder system that reduced missed fines and warrants that have helped the City’s Court see an annual 187,000 increase in revenue.

Using Data to Power Innovation

G.T. Bynum has leadership in his veins. One of the youngest people ever elected mayor of Tulsa, Oklahoma, he’s the fourth person in his extended family to serve in the role since the turn of the last century. But he is the city’s first mayor to place data-driven decision making at the top of a change agenda. Since becoming mayor in December 2016, his administration has marked a turning point in how Tulsa uses data to power innovation and improve the quality of life in Tulsa.

Mayor Bynum didn’t waste any time after being elected. The idea of improving city services and using data to make key decisions was at the core of his mayoral campaign. One of his first moves as Mayor was the creation of the Office of Performance Strategy and Innovation (OPSI). The office works to align the city’s top goals with effective strategies. It quickly became key to the city’s data-driven transformation, says James Wagner, who led OPSI at its inception and is now the city’s director of finance and CFO.

Ben Harris, OPSI’s Data Analytics Manager, convened a team of employees from 16 departments to lead the city’s data governance and strategic planning efforts. The Data Governance Committee, which sets the standard and strategy for data quality, integrity, and use for the city government, has helped integrate the use of data citywide through the creation of a Central Data Repository where any employee or resident can request data.

“Through this cross-departmental team, we encourage transparency, access to data, and a feedback loop; ultimately it creates a trust relationship between departments,” Harris said.

“In addition to teamwork, technology played a huge role in orchestrating communication, automating data movement, securing data, and making it accessible.”

Data Analytics Manager Ben Harris

OPSI and the Committee also facilitate regular sessions with department leaders to focus on the value of performance metrics. These meetings aren’t just about tracking progress reviewing data — they’ve created a new space within the city to cultivate innovation.

“Mayor Bynum and other city leaders have consistently looked to OPSI to drive data-driven innovation work in Tulsa. This matters because we’re making real changes that improve city services and save taxpayers money.”

Chief Financial Officer James Wagner

A Caring Fire Department

For years, the number of calls to the Tulsa Fire Department was increasing, putting stress on their resources and capacity. By analyzing the data, the fire department discovered the source of the increased calls was not an increase in fires, but instead an increasing aging population who needed lift assists. Lift assists are calls to the 911 system for a non-emergency fall — the help the resident is requesting is to literally be picked up off of the ground. The city discovered a repeat lift assist pattern, with some residents requesting a lift assist as many as nine times a day.

Under the direction of Chief Michael Baker, the Fire Department developed and launched the Tulsa Community Assistance Referral and Educational Services (CARES) program, which was designed to connect high-utilizers of the emergency system to healthcare and social service providers. Visits to the highest utilizers became proactive, with the CARES team working on simple fixes such as installing low-cost solutions like handrails and opening up a dialogue with the resident’s primary care doctor. Within the first three months of the pilot, the fire department saw a 70 percent reduction in calls from its top 911 utilizers.

With preliminary results in hand, Baker presented his findings through the TulStat forum.

“TulStat,” based on the successful “LouieStat” program out of Louisville, Kentucky, has created a forum for change in Tulsa. City leaders gather to discuss priority problems, define success, innovate solutions, and develop methods for measuring progress. They identify specific, quantifiable goals, such as average time for reviewing building permit applications (previously 5 weeks, now 92 percent completed in 5 days) or responding to a 911 call, and troubleshoot obstacles to achieving them.

While CARES was developed before Bynum’s administration founded TulStat, having a space to build off of the pilot’s success was critical in connecting more residents to much-needed services. The program has served 204 clients; in 2020, four Tulsans have “graduated” the program and have the needed support services in place for them to live safely in their homes.

In the future, CARES hopes to work with OPSI to expand their data capacity to learn how to predict who is at risk for becoming a repeat caller to the 911 system and intervening early to distribute tools and services. Aligning community resources to provide innovative, proactive care will not only save the city’s Medicare and Medicaid partners money, it could save a resident’s life.

Breaking the Cycle

Working with What Works Cities and the Behavioural Insights Team, OPSI also helped the Tulsa Municipal Court solve a problem that had burdened the court and vulnerable residents for years.

Previously, when the court issued a resident a fine in a criminal case, but that resident wasn’t able to pay that fine on time, the court would offer an extension in the form of a “Time to Pay Order.” Some found themselves with a fine due more than 12 months in the future — enough time for them to save money for the payment, but also plenty of time to forget when it was due. As of early 2018, more than 70 percent of those orders resulted in a failure-to-pay warrant. For many, a warrant can exacerbate the cycle of poverty: a driver’s license might be suspended and additional fines can accrue, pulling someone further into the criminal justice system.

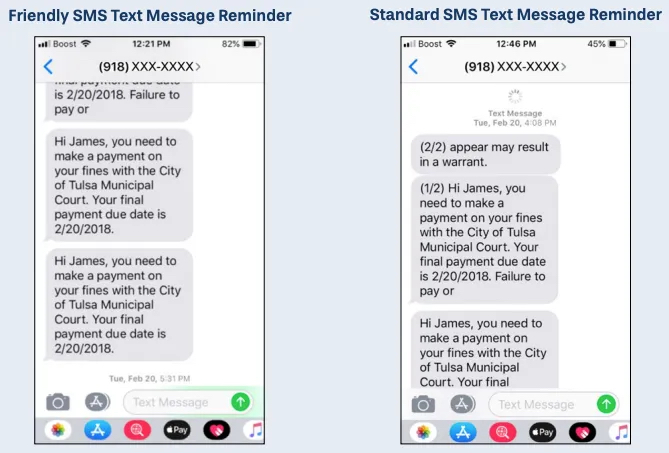
To combat the problem, OPSI partnered with the Court and Code for Tulsa to figure out how to reduce the number of warrants issued. Within a month, a text message pilot project was underway, designed around a simple hypothesis: Many people missed their Time to Pay Order deadline because they forgot the due date or lost paperwork. Together, OPSI, the Court, and Code for Tulsa developed a system to text simple, personalized reminders to a randomly selected pool of Time to Pay Order recipients. The test group received a text message reminder once a month leading up to their deadline.

Image Courtesy of the City of Tulsa.

The results were remarkable. During the six-month pilot, 63 percent of those who received a reminder paid all of their outstanding fees, compared to 48 percent of residents who did not receive reminders. Armed with data showing this 15 percent point increase, the Court system adopted the new reminder system. It now estimates an additional 320 people are paying their fees on time each year, avoiding warrants and additional problems because of the system. The Court benefited as well, seeing an annual $187,000 increase in revenue and a morale boost among employees who helped implement the solution.

“I’ve never been so excited about a job,” said Jamie King, a cost administrator at the court.

At the City’s Core

OPSI’s successful partnerships with city departments go beyond the fire department and courts. Three years in, OPSI has implemented practices and programs that have positioned Tulsa as a leader in data and innovation. In 2017, the office launched Urban Data Pioneers, an award-winning program consisting of teams of residents and city employees who analyze data to help the city solve key challenges and present policy recommendations.

With OPSI’s clear-cut ability to drive innovation, Mayor Bynum decided to integrate the office into the city’s key funding decisions. When Wagner became Director of Finance and CFO in early 2019, he brought OPSI with him to the Finance Department. This has changed the way Tulsa funds innovation. In essence, a data-driven approach has been institutionalized and scaled. Today, the city bases funding on data that proves programs work. OPSI vets data.

“We had the opportunity to take the approach and plug it into the finance department,” Mayor Bynum said. “It helps make it have much more of a citywide cultural impact.”

Join Our Certified Cities!

Syracuse, New York, USA

In Syracuse, Data Delivers Efficient, Effective and Equitable Services.

Project Type:
Equity, Finance, High-Performing Government, Housing, Infrastructure

2023 Gold Certification


Several years ago the City of Syracuse teamed up with the Syracuse Metropolitan Transportation Council (SMTC) to create a data-driven prioritization for road reconstruction. This year, the City and SMTC introduced an equity component to the priority scoring process to ensure that the City does not overlook roads in historically underserved neighborhoods. Inspired by equity score systems in other cities, the City created a metric to measure the amount of historically underserved residents in an area. The new model considers the equity score as well as road conditions when recommending reconstruction projects for the year. In this way, the City avoided completely reinventing the reconstruction priority process while introducing equity as an additional factor.

2021 Silver Certification


Compiled data from GPS units in each snowplow, allowing the city to create and publish an interactive map for residents to determine if a street was already plowed and allowing city staff to quickly identify any streets a snowplow may have missed on its run.


Created a database mapping sidewalks and walkways in 164 parks in order to improve its approach to snow removal, empowering the city to lower the average time to clear paths of snow from 3 days to 6 hours.


Gave city departments centralized access to budgeted and actual financial data, allowing staff to better predict funding needs and allocate resources. Analysis from this data saved the city an estimated $800,000 on salt used for de-icing.


Determined locations for new affordable housing construction by gathering and analyzing quantitative data on the locations of vacant properties and qualitative data from 800 resident interviews.

The Snowiest City

Syracuse, New York is seriously snowy. Averaging more than 120 inches of snowfall each year, it’s officially the country’s snowiest city. Throughout each long winter, staff in the Department of Public Works (DPW) work to keep roads and sidewalks clear and safe so residents can keep moving. Until a few years ago, Syracuse’s snow removal services were challenged, resources were limited, and many residents weren’t happy.

“I used to want to avoid Facebook every time we had a storm,” says Corey Dunham, the City’s chief operating officer. “There were just too many friends and family complaining about the snow on their streets!”

When Mayor Ben Walsh took office in 2018, he was determined to take a new data-driven approach to tackle persistent problems facing Syracuse residents. Whatever the problem in Syracuse today, a first step toward designing a solution is to dig into data. “You can’t fix what you don’t fully understand,” Mayor Walsh said in his 2019 State of the City address. Data helps the City understand the causes of problems and address them, he added.

With clear support from the Mayor’s Office, city staff have worked in recent years to build foundational data practices including general management, performance & analytics, and open data to improve the delivery of city services like snow removal. The aim is to deliver efficient, effective, and equitable services — a goal that has become core to Walsh’s administration.

“We’re not data-driven for the sake of being data-driven. Data empowers us to know if we’re being effective or not, and then pivot when we need to change.”

Syracuse Mayor Ben Walsh

Deputy Mayor Sharon Owens admits she was once a “data nonbeliever.” Now she has the passion of a convert. “Being able to use data to hone in on quality-of-life issues is crucial,” Owens says. “We spend too much time sending out a wide net when we should be honing in. Residents are impacted by our ability to take data and use it to solve the problems they care about.”

Plowing Through Data

The Parks Department and DPW’s effort to overhaul how they prioritize clearing snow from roads and sidewalks shows how data can translate into better and more transparent city services.

During snow events, the DPW snow plows move into action. The department follows a system of prioritizing city streets for snow removal: the first priority is always emergency routes, followed by hills around the city and roads with significantly higher levels of traffic. Flatter city streets generally found in residential neighborhoods come next.

Clearing the City’s streets after a snowfall. Image courtesy of the City of Syracuse.

The City compiled data from GPS units in each snowplow to create and publish an interactive map on the City website, enabling residents and property owners to track the path of snowplows during storms to determine if a street was already plowed. The map includes timestamps of a plow’s most recent pass of a street. The data also equipped the DPW staff to more quickly and accurately identify any streets a snowplow may have missed on its run.

To improve sidewalk snow clearance, the City took a similar approach. Working with the Syracuse Metropolitan Transportation Council, a team of DPW staff members and transportation planners first mapped foot traffic, building a dataset detailing which sidewalks are used most frequently and which are adjacent to the most dangerous streets. Again, data analysis showed the obvious snow removal strategy.

“We determined the most dangerous streets for pedestrians and cleared sidewalks in those areas first. Using data, we were able to make and defend decisions about why we chose to clear certain streets and sidewalks over others.”

Chief Operating Officer Corey Dunham
Image courtesy of the City of Syracuse.

The Department of Parks, Recreation and Youth Programs also dug into data to improve its approach to snow removal. The first step was mapping all the sidewalks and walkways in Syracuse’s 164 parks it is responsible for — 13 miles total, the department learned. Previously it would take three days after a major snow event to clear all sidewalks and walkways. After creating a color-coded map making priority routes clear — and buying two Bobcat L28 machines enabling a sidewalk to be cleared in just one pass — the department now clears them in just six hours.

Syracuse officials have also used more data-driven budgeting practices to save money on road de-icing materials. Previously, each department across the city was managing its own financials and budgeting from budget-to-budget, instead of actuals-to-budget. By centralizing the budget planning process and providing actuals to departments, Syracuse was able to make better spending decisions. This approach allowed DPW to analyze data for how much salt it purchased each year for de-icing and how much salt it actually used. The ultimate outcome: officials were able to better predict how much salt they needed to buy. Last year, the data-driven effort helped the city save an estimated $800,000 on salt purchases.

More Results to Come

Syracuse’s efforts to strengthen its data culture and practices have yielded benefits beyond snow removal. The City has also used data-driven problem-solving skills to address more complex challenges, such as poverty, inequities highlighted by the COVID-19 pandemic, and neighborhood revitalization efforts.

Looking ahead, exciting things are in the works — all fueled by the data capacity Syracuse has built. Later this month, the City plans on unveiling a brand-new resident information system revamping its city service request system into a more comprehensive and user-friendly portal.

And by the end of the year, Syracuse will build the first 25 of 200 one- and two-family housing units through the new Resurgent Neighborhood Initiative (RNI). The program supports city neighborhood planning and revitalization at the block level. Affordable housing construction locations were chosen by analyzing quantitative data detailing the locations of vacant and unused properties, and gathering qualitative data through 800 resident interviews conducted over eight months. This stakeholder engagement helps ensure equity, so the City can better deliver on the promise of affordable housing.

“Whether the challenge is housing, a pandemic, or snow removal, being a data-driven city means efficiently, effectively, and equitably delivering services that taxpayers pay for,” Mayor Walsh says. “This is the nuts and bolts of local government.”

Join Our Certified Cities!

Disclaimer