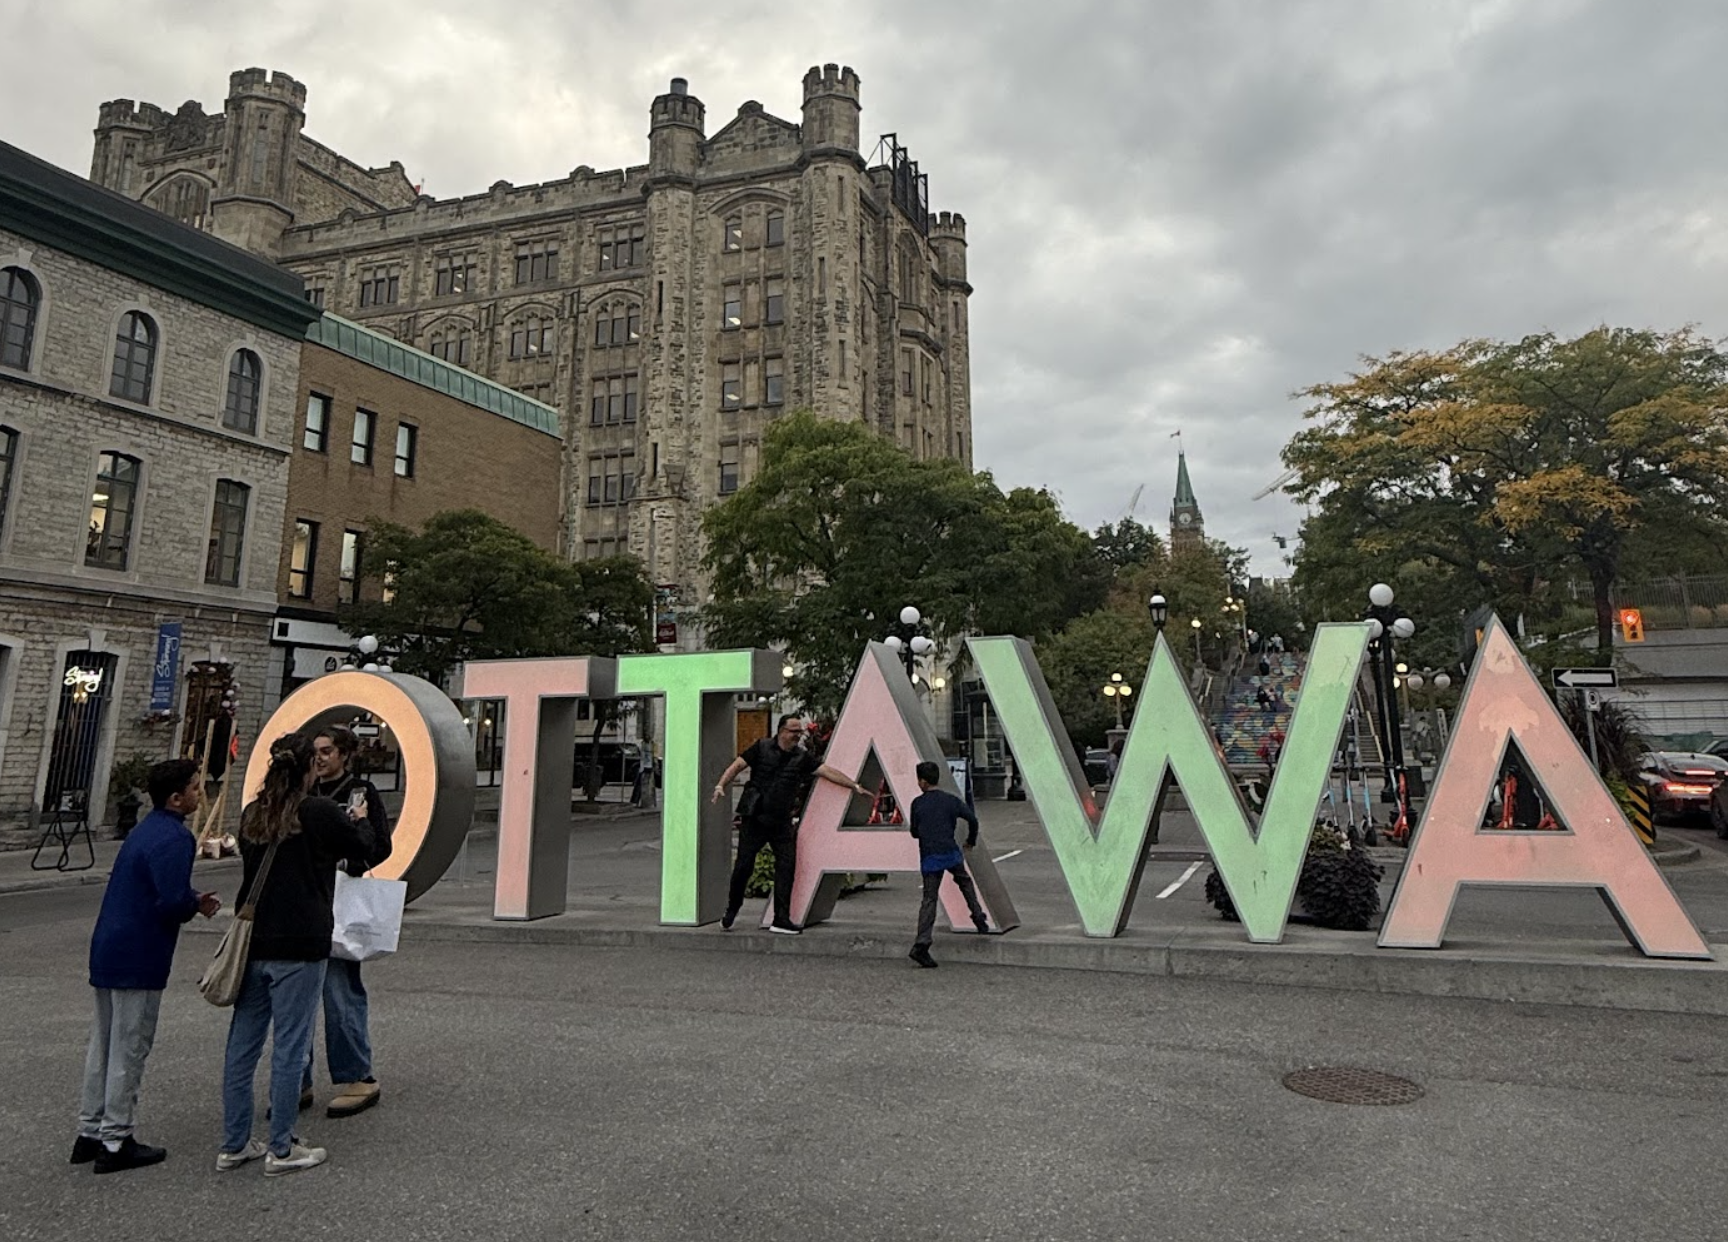
Ottawa, Canada
Ottawa’s Digital Solution to Increasing Housing Supply
Project Type:
Housing, Infrastructure and Utilities, Technology

At a Glance
Ottawa’s digital twin helps speed up approvals by integrating multiple data sources to show how proposed developments align with neighborhoods, zoning and building codes.
$300,000 estimated annual savings in staff time through the digital twin.
Improving homelessness data collection and reporting, reducing the initial data cleanup time from two months to one hour.
More than 1,000 students have participated in CityStudio Ottawa, a partnership that connects university students with city staff to develop solutions to community challenges.
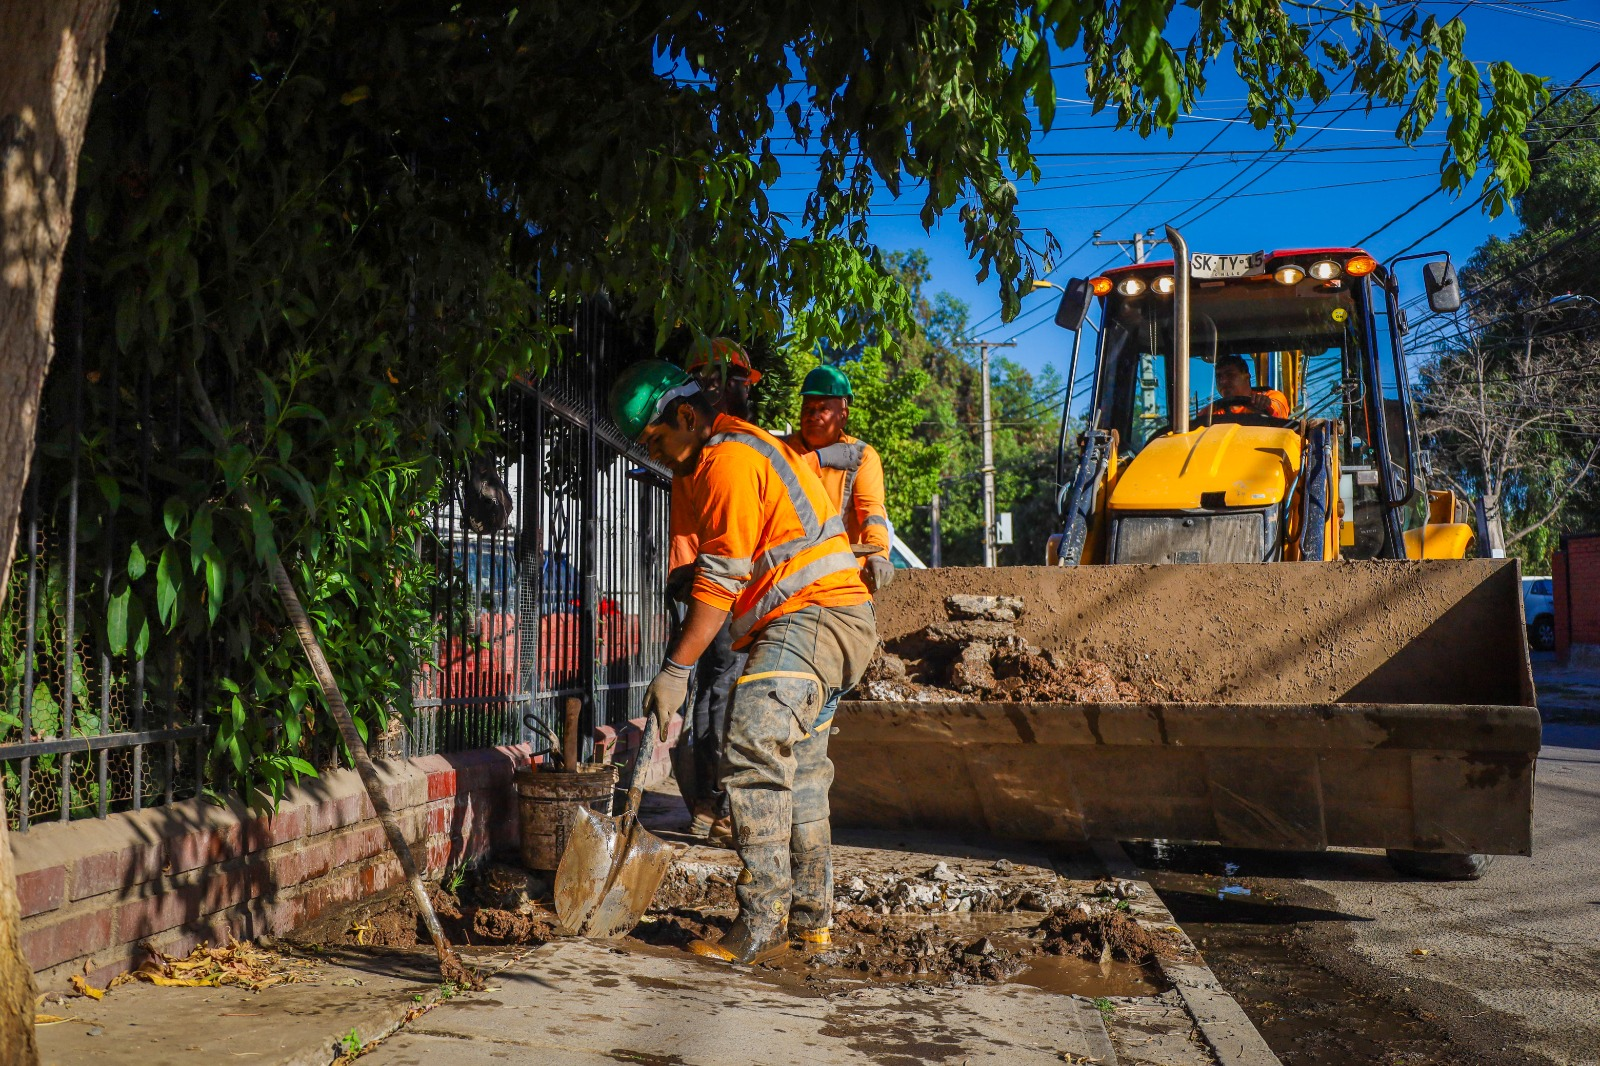
The City of Ottawa is ready to build.
Driven by a rapidly growing population — 10% increase since 2020 — Ottawa’s housing is under strain and leaders are going all in to ensure stable, safe and affordable housing for the City’s 1.2 million residents.
As of November 2025, new housing construction was up 22% from 2024, but thousands of homes will need to be built to alleviate affordability challenges. To do this, the City is reducing barriers to new construction, making development easier and faster by simplifying regulations, lowering fees and charges, and introducing a new zoning bylaw.
“Urban challenges demand connected solutions — Ottawa’s digital twin brings planning, policy, infrastructure and operations together into one intelligent platform, powering housing, mobility and resilience for a truly smart city.’”
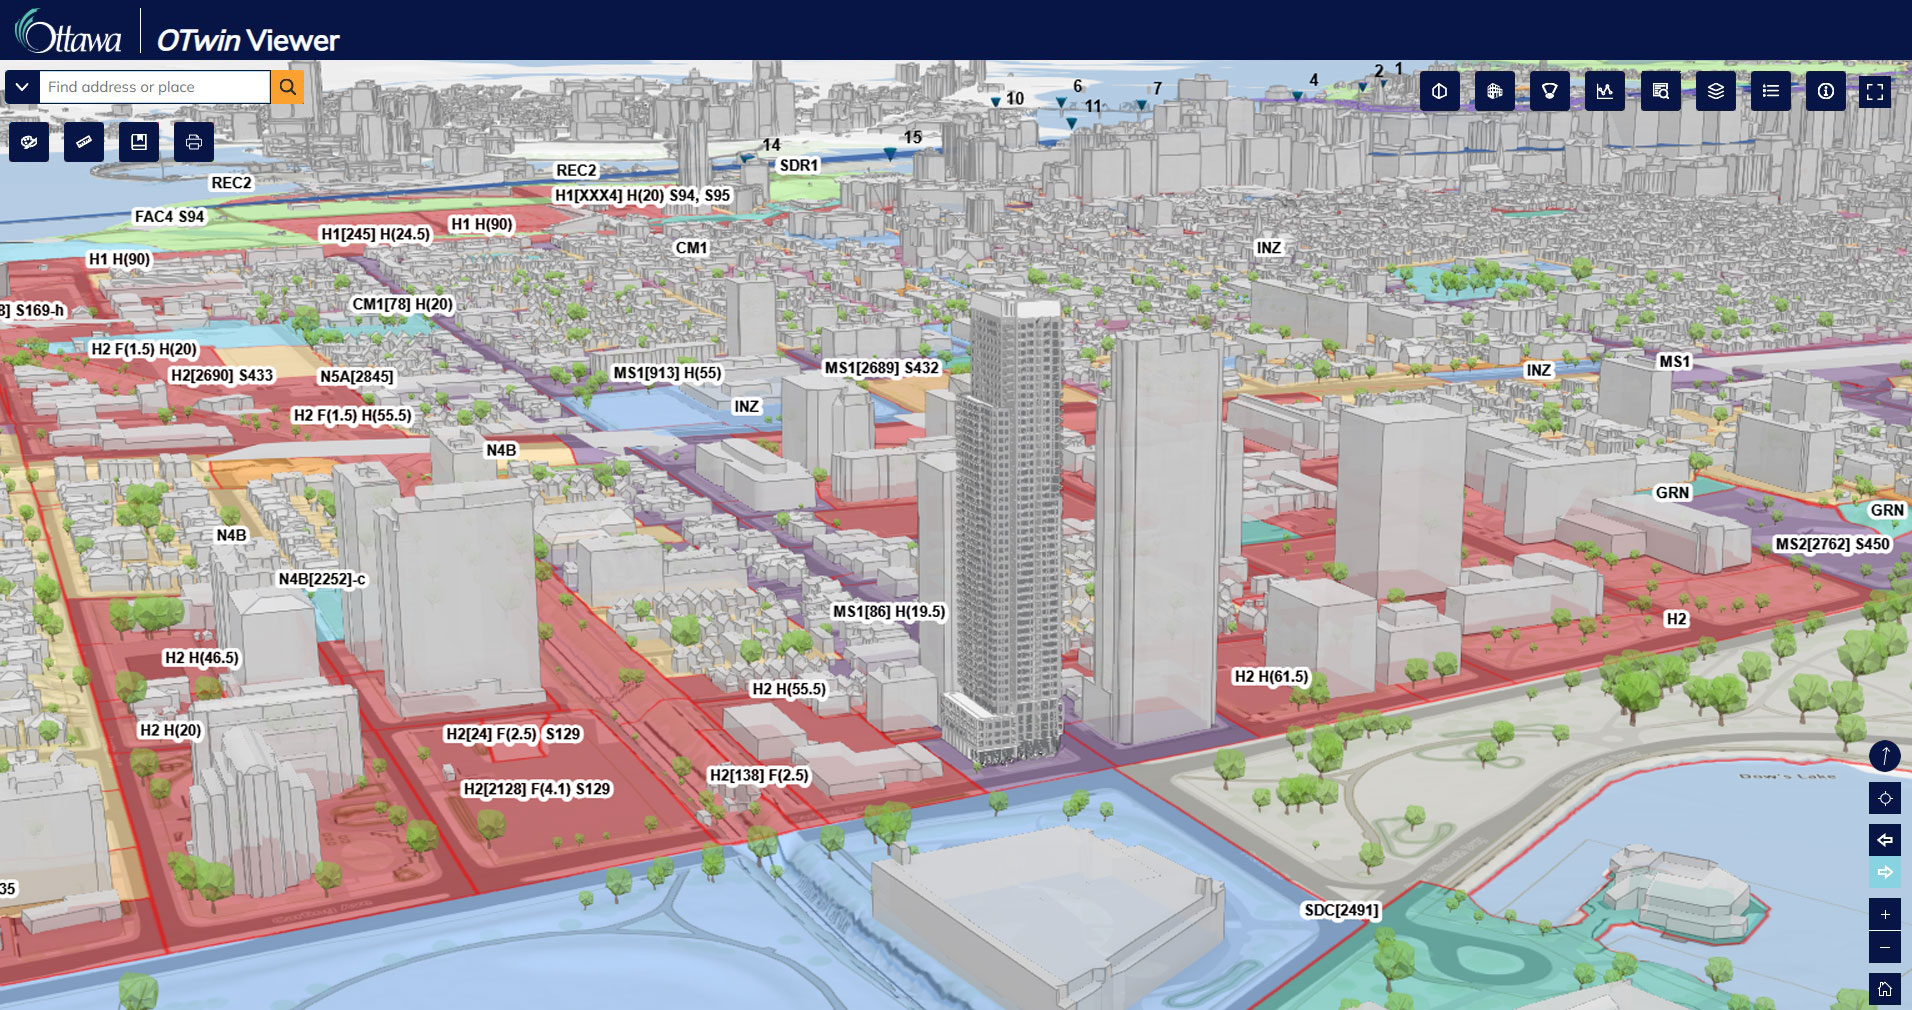
Ottawa isn’t the only city enacting sweeping changes to increase housing supply, but it is one of a few cities with a state-of-the-art digital twin supporting its housing goals. The digital twin is a highly detailed, interactive digital replica of Ottawa’s buildings and infrastructure. It has every streetlight, sewer pipe and sidewalk. Every city tree at scale.
Launched in early 2024 in conjunction with a new zoning bylaw, the digital twin helps residents better visualize how policy changes affect neighborhoods by shifting from static maps to an interactive 3D zoning viewer. For instance, residents can now see how new maximum building heights would look on their street, allowing them to better understand the proposed zoning and engage with the City.
It’s also a game-changer for development.
Ottawa’s digital twin combines aerial imagery, LiDAR point clouds (3D sets of laser-generated spatial points), 360° street-level photos, zoning and policy data, utility networks and more, into an intelligent platform. This isn’t a static map — it’s a predictive engine delivering real-time insights for planning, development and city operations.
By providing planners and policymakers with real-time, integrated data, the digital twin streamlines housing development decisions. Through the O-Twin Viewer platform, city staff can quickly assess how proposed developments align with neighborhoods, zoning and building codes without relying on manual analyses or static maps. It also offers tools tailored for urban planning and development, including AI-powered scenario modeling, development sightline analysis and sun/shadow analysis. An AI chatbot to assist planners with the new zoning bylaw is in development, along with AI-powered solutions for building code compliance and permit approvals.

Beyond housing, the digital twin has wide-ranging benefits: The City is using machine learning to identify and catalogue its physical assets, such as street signs and light poles. The digital twin also supports emergency response, flood mapping, solar rooftop analysis, heat island studies and water rate planning, to name a few.
The digital twin isn’t just an example of cutting-edge technology, it is a pioneering tool to make city planning more accessible, efficient and cost-effective — with the ultimate goal of ensuring Ottawans can live, work, play and thrive in Canada’s capital city.