Savannah, Georgia, USA
Using Data to Guide a Parks and Rec Transformation
Project Type:
Community Engagement, Parks and Recreation, Public Safety, Transportation

At a Glance
The Recreation Reimagined initiative uses resident feedback and detailed data on facility conditions to prioritize investments in aquatic centers, athletic facilities and community centers.
Traffic calming and pedestrian safety improvements cut fatal traffic accidents by 56% and serious injury crashes by 33% between September 2023 and September 2024.
Savannah’s Community Partnership Program takes a results-driven approach to collaborating with nonprofits by contracting for services via a competitive process.
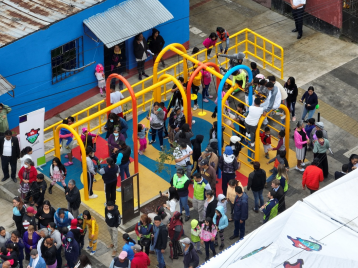
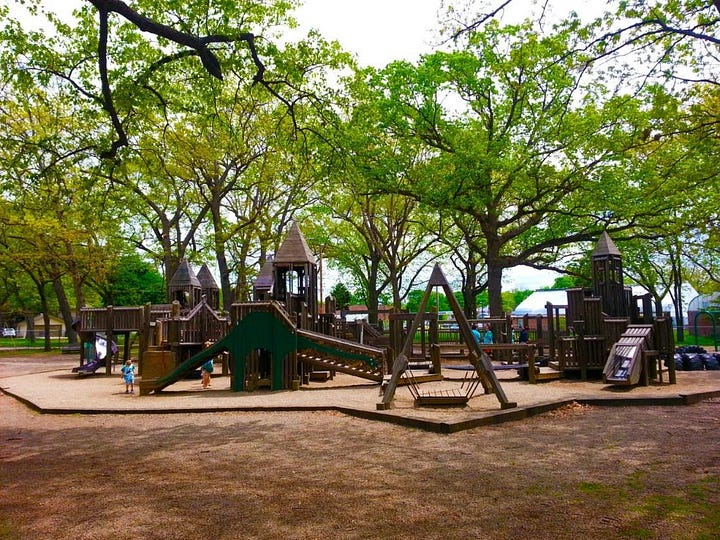
If you want to see how Savannah is transforming its parks and recreation facilities, it’s best to pick a hot summer day. That’s when the city’s sparkling new splash pads buzz with kids dashing through spray fountains and newly renovated public pools are packed with swimmers.
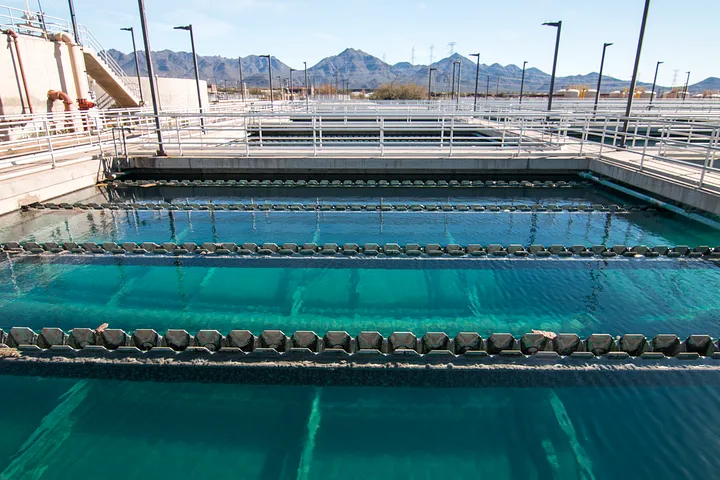
It wasn’t always like this. Savannah had underinvested in recreation for years. Splash parks were little more than weathered concrete slabs where water poured out of a pipe. Pools had not been resurfaced in 20 years, and were often closed due to equipment failures.
The revitalization is the result of Recreation Reimagined, a city initiative that is improving parks and rec programming and upgrading recreation facilities across Savannah using federal pandemic relief dollars. Tired community centers are getting fresh coats of paint, new furniture and gaming consoles to attract teenagers. Basketball and tennis courts are getting resurfaced. Athletic fields are getting new lighting and turf. And playgrounds are getting new slides, swings and play equipment.
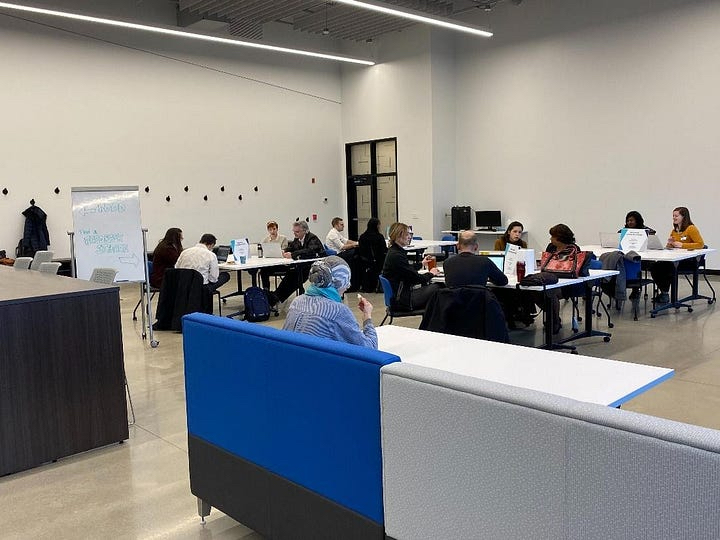
“We’ve created a new Information and Public Affairs Service Center. Their job is to wake up every day thinking about data — how we collect it, how we visualize it, how we analyze it, how we use it to make decisions, how we use it to engage residents to understand their needs and involve them in decision making, and how we use it to tell our story better.”
40 percent increase in pool attendance from 2023 to 2024
37 percent increase in youth program participants from 2023-2024
13 percent increase in senior meals served from 2023 to 2024
City leaders grounded the entire effort in data. First, they surveyed more than 800 residents on the state of current recreational services and what amenities they wanted to see. Splash pads and pool renovations ranked high on that list, as did walking and biking paths, playgrounds and dog parks. City leaders used this data as one of their guides in deciding what kinds of facilities to invest in.
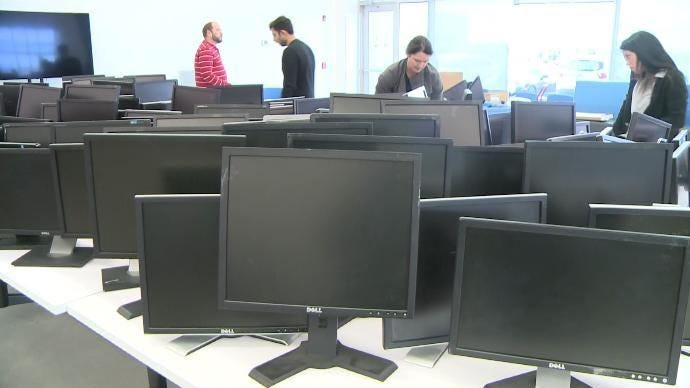
Next, they sent city staff across Savannah to conduct the city’s first physical assessment of every picnic table, bike rack, trail, trash can and see-saw — more than 5,000 items in all. Before the assessment, the City trained staff on how to classify both the appearance and functionality of equipment using the same methodology to yield consistent citywide data.
“Oftentimes, departments request funding but they don’t have data to back it up — it’s just ‘take my word for it,’” says Taffanye Young, Savannah’s Chief Community Services Officer. “Having this data was a big help for us.”
One way the data helped was in prioritizing investments to public spaces with the greatest needs (based on the resident survey and physical assessment). The data also enabled city leaders to bundle procurements for everything from playground equipment to court resurfacings, yielding lower prices and helping to deliver results quickly.
Residents can see the difference, and are coming out to parks and rec facilities in greater numbers. In 2024, pool attendance was up 40 percent over the previous year, participation in youth programs was up 37 percent and 13 percent more meals were served to seniors.
“I firmly believe that the quality of your facilities speaks volumes about how much you care about the people who live there,” Young says. “Our focus is to show that we’re good stewards, prioritize the projects and deliver quick victories. We want people out in these neighborhoods saying, ‘A year ago I said I wanted a splash pad, and now it’s here.’”
“Achieving What Works Cities Certification shows that we’re really moving the needle. You can’t make that judgement internally. You have to have someone outside look at what you’re doing. When I first explained to our team about pursuing Certification, I told them it might reveal some truths about ourselves that we don’t like. But we’ll take it, and we’ll learn from it, and we’ll adjust.”