Dayton, Ohio, USA
A First-of-its-Kind Approach to Alternative Emergency Response
Project Type:
Community Engagement, Health and Wellbeing, Housing, Infrastructure and Utilities, Public Safety
At a Glance
Created alternative emergency response teams staffed with professional mediators. Since 2022, 7,202 emergency calls have been diverted to mediators and only 2% have required police intervention.
City leaders believe the mediation response unit model to be the first of its kind in the United States.
A new system for routing and tracking trash pickups gives the City better data for improving performance.
Replaced paper housing inspections to digital, enabling the City and residents to view all housing condition data on a public dashboard.
Since 2020, dozens of U.S. cities have created community response teams to divert some non-emergency calls away from police officers. A big focus of these unarmed response teams, which are usually staffed by trained clinicians, is calls related to persons experiencing mental or behavioral health problems.
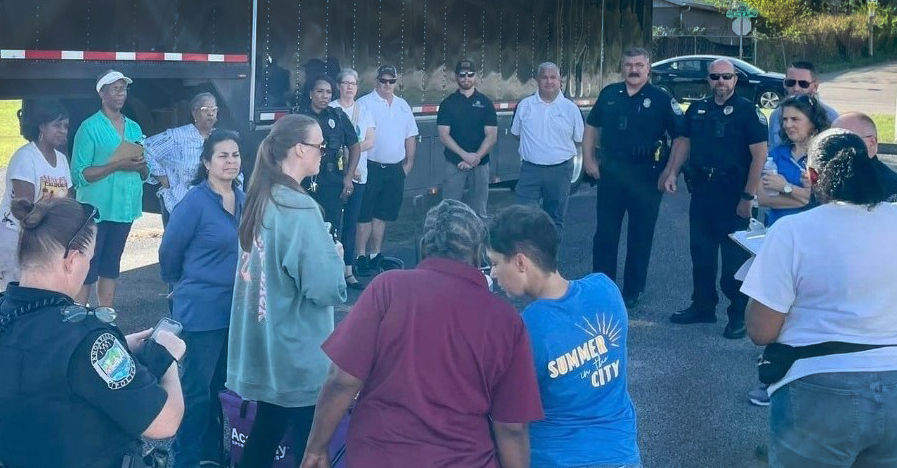
Dayton’s program is a little different. Alternative response in Dayton is focused largely on calls related to arguments between neighbors, noise complaints, roommate disputes, unruly behavior and other forms of nonviolent conflict. When someone dials 911 with one of these issues, the call is screened by Dayton Medication Response Unit and if appropriate MRU staff self-dispatches to the call.
The team includes professional mediators who are trained to respond to crisis and de-escalate conflict. They create space in the moment for people to vent and feel heard, help resolve conflicts and follow up later to see if there are lingering issues. While many cities across the United States have alternative emergency response programs focused on mental health crises, this is the country’s first model focused on mediation.
98% of calls do not require police backup.
“People are now calling the Mediation Response Unit directly instead of calling 911. That’s a good thing, because it’s changing the culture of how people request the right service for what they need.”
The idea for the Mediation Response Unit came out of a working group made up of community members and city officials. The approach is built on 911 call data; working group members collaborated with issue experts to identify types of calls that could be handled by mediators instead of police.
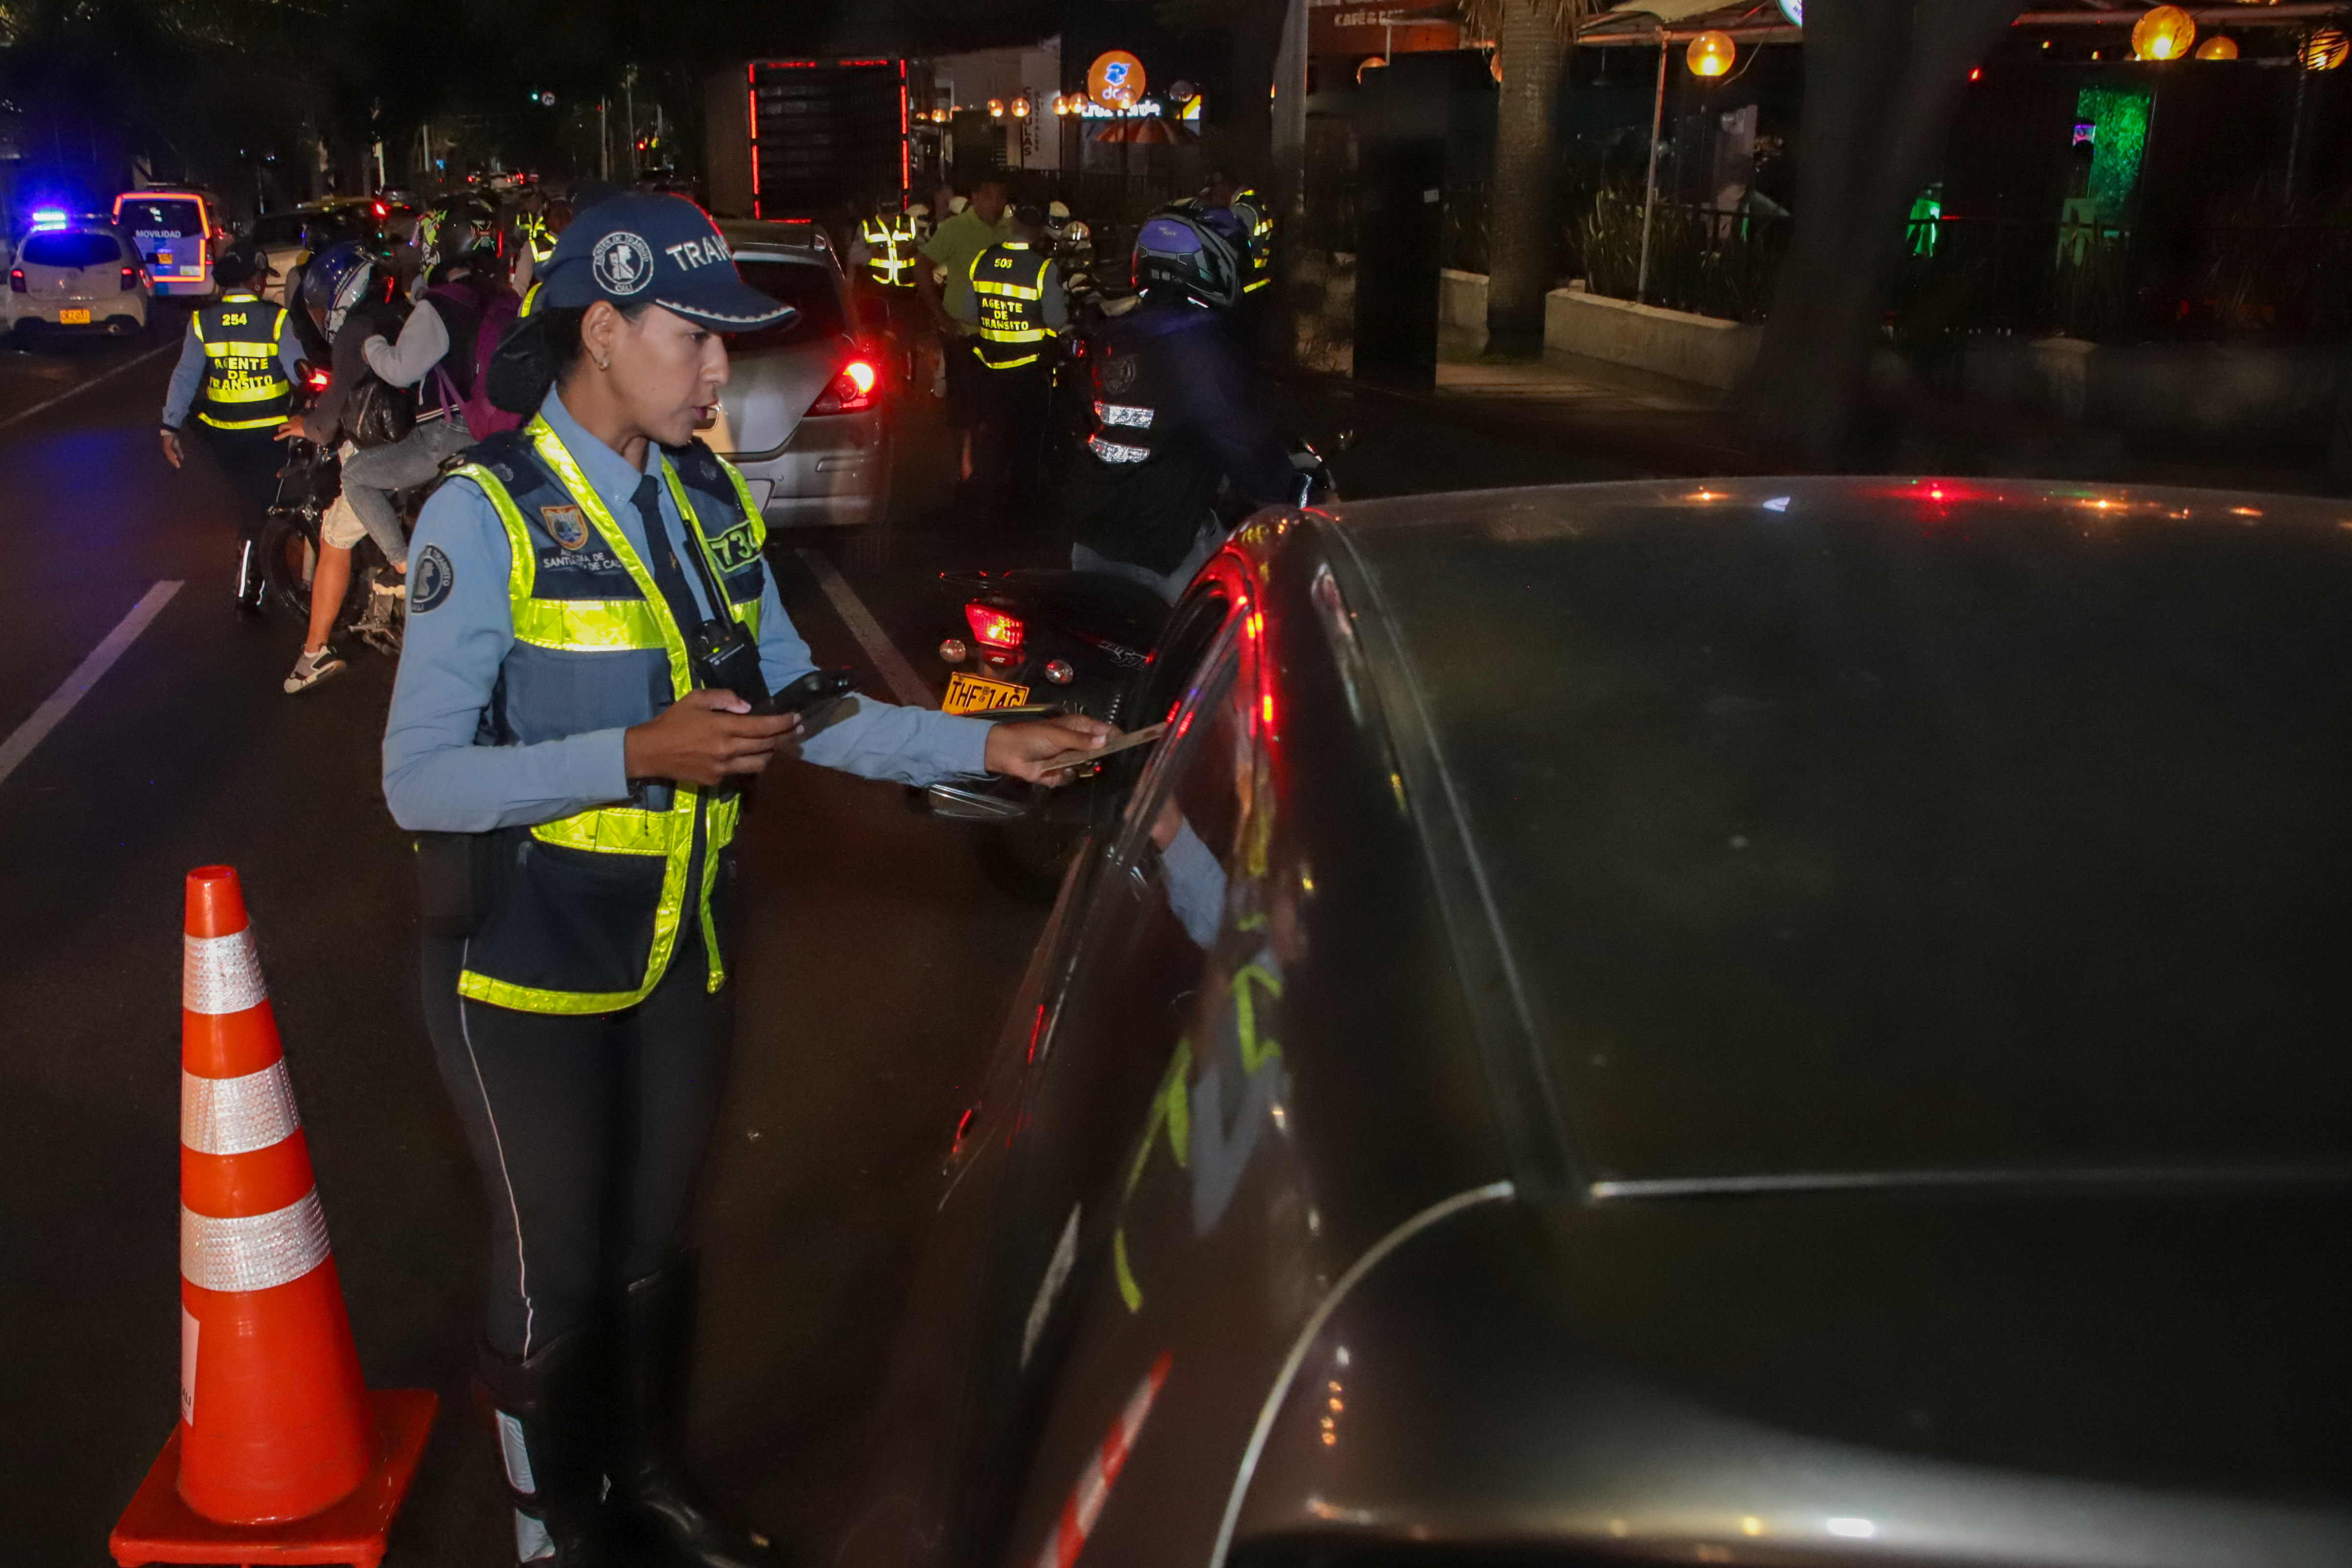
Now, MRU self-dispatches after screening out for violence, after screening for violence, weapons, or other situations that would necessitate a police response. As residents get to know that the mediation unit exists, they are increasingly calling a direct MRU call line to reach the unit directly rather than calling 911. That means both dispatchers and police are freed up to handle more pressing matters.
7,202 emergency calls diverted to mediators as of November 2025
In the first three years, the service has fielded more than 7,000 service calls. They are tracked on a public dashboard that is updated nightly and shows what types of calls are coming in from which parts of the city. As a case study of the program from the Council of State Governments notes, the City uses this data to assess trends, spot service gaps and identify changes needed. Approximately 2 percent of calls have required a police officer to be called for backup, a sign that the system is handling the right kinds of cases.
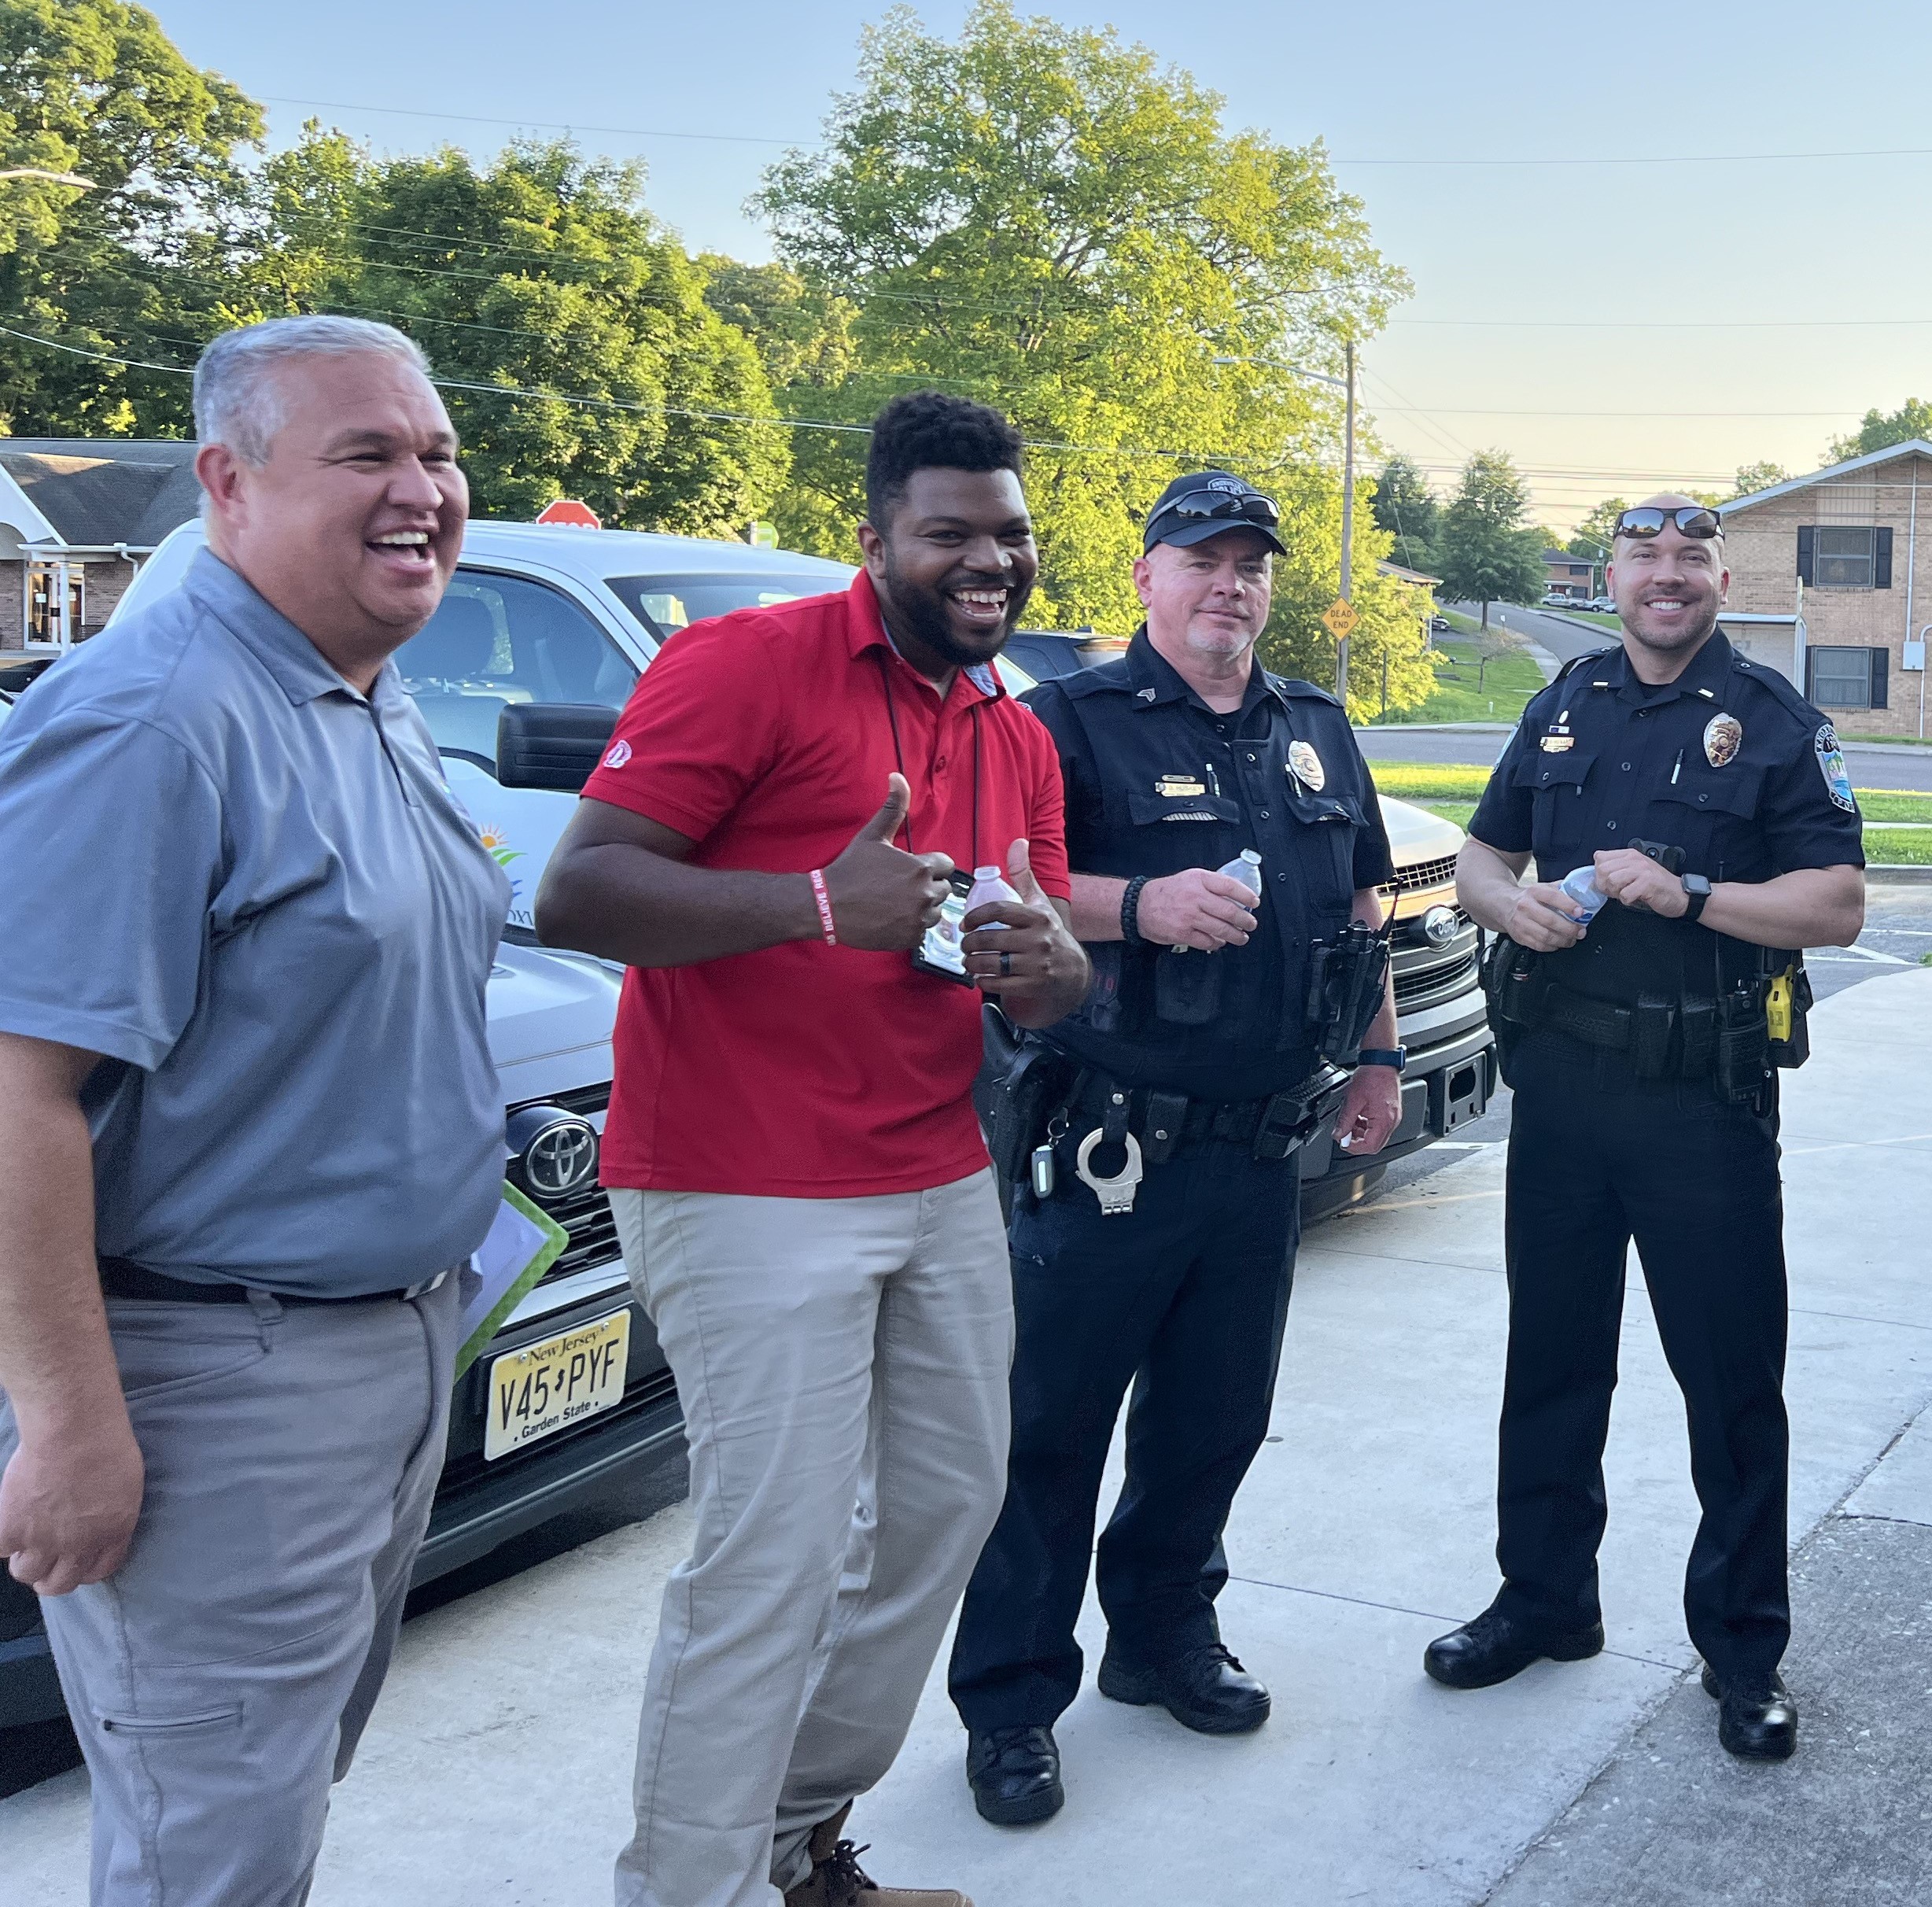
“The mediators are doing a fantastic job,” says Michelle Zaremba, Mediation Division Manager for the City of Dayton. “Callers get a lot of time with the responders. They can talk with them and really express what’s frustrating to them. But also for the person they’re calling on, it’s less offensive to have somebody who’s not a police officer come out.“