Edmonton, Canada
Edmonton Leads the Way in Traffic Safety with a Data-Driven Approach
Project Type:
Transportation

At a Glance
The Open Performance website tracks strategic goals and trends, helping the city manage performance, address community needs, and deliver results that matter to Edmontonians.
In 2015, Edmonton became Canada’s first major municipality to adopt Vision Zero. Since then, the program has leveraged data to help reduce traffic fatalities by 50% and injuries by 32%.
In 2024, Edmonton became the first municipality in Canada to introduce auto-review for housing development permits, a digital tool allowing applicants to apply for a permit and start building on the same day. Streamlined services like auto-reviewed permits and reduced fees save an estimated $5.3 million CAD and 67,600 days annually.
In just five years, Edmonton has supported the development of 5,571 affordable housing units – more than double the previous decade’s total.
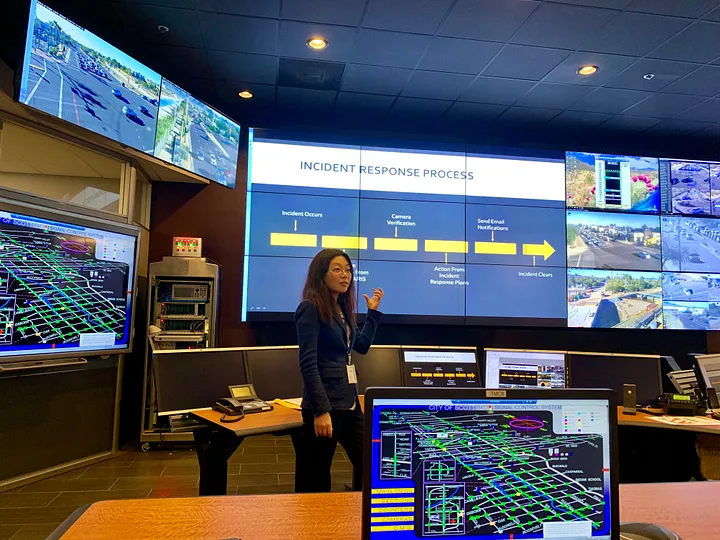
The City of Edmonton has been at the forefront of traffic safety since 2006, when it launched North America’s first municipal Office of Traffic Safety. Back then, the city had one of the highest per capita collision rates among major Canadian cities. Nearly two decades later, the office remains a leader in innovation, using data as its guiding principle.
Today, a dedicated team of 50 full-time staff is driving Edmonton’s Vision Zero goal of eliminating all traffic fatalities and severe injuries by 2032. Since adopting Vision Zero in 2015, the City has achieved remarkable results: traffic fatalities have dropped by 50% and serious injuries by 32% when comparing data between 2015 and 2021.
“Nobody likes change. But at the end of the day, when you see the results and when you can feel the actual extra safety, it’s worth it.”
“Data allows us to foster trust and confidence in the organization overall because it lays everything out and says, ‘Well, here’s where we’re at. Here’s where we probably should be and where you expect us to be. Let’s talk about that gap and let’s talk about what are the trade offs in order to close that gap – provide more funding or moderate those expectations.’”
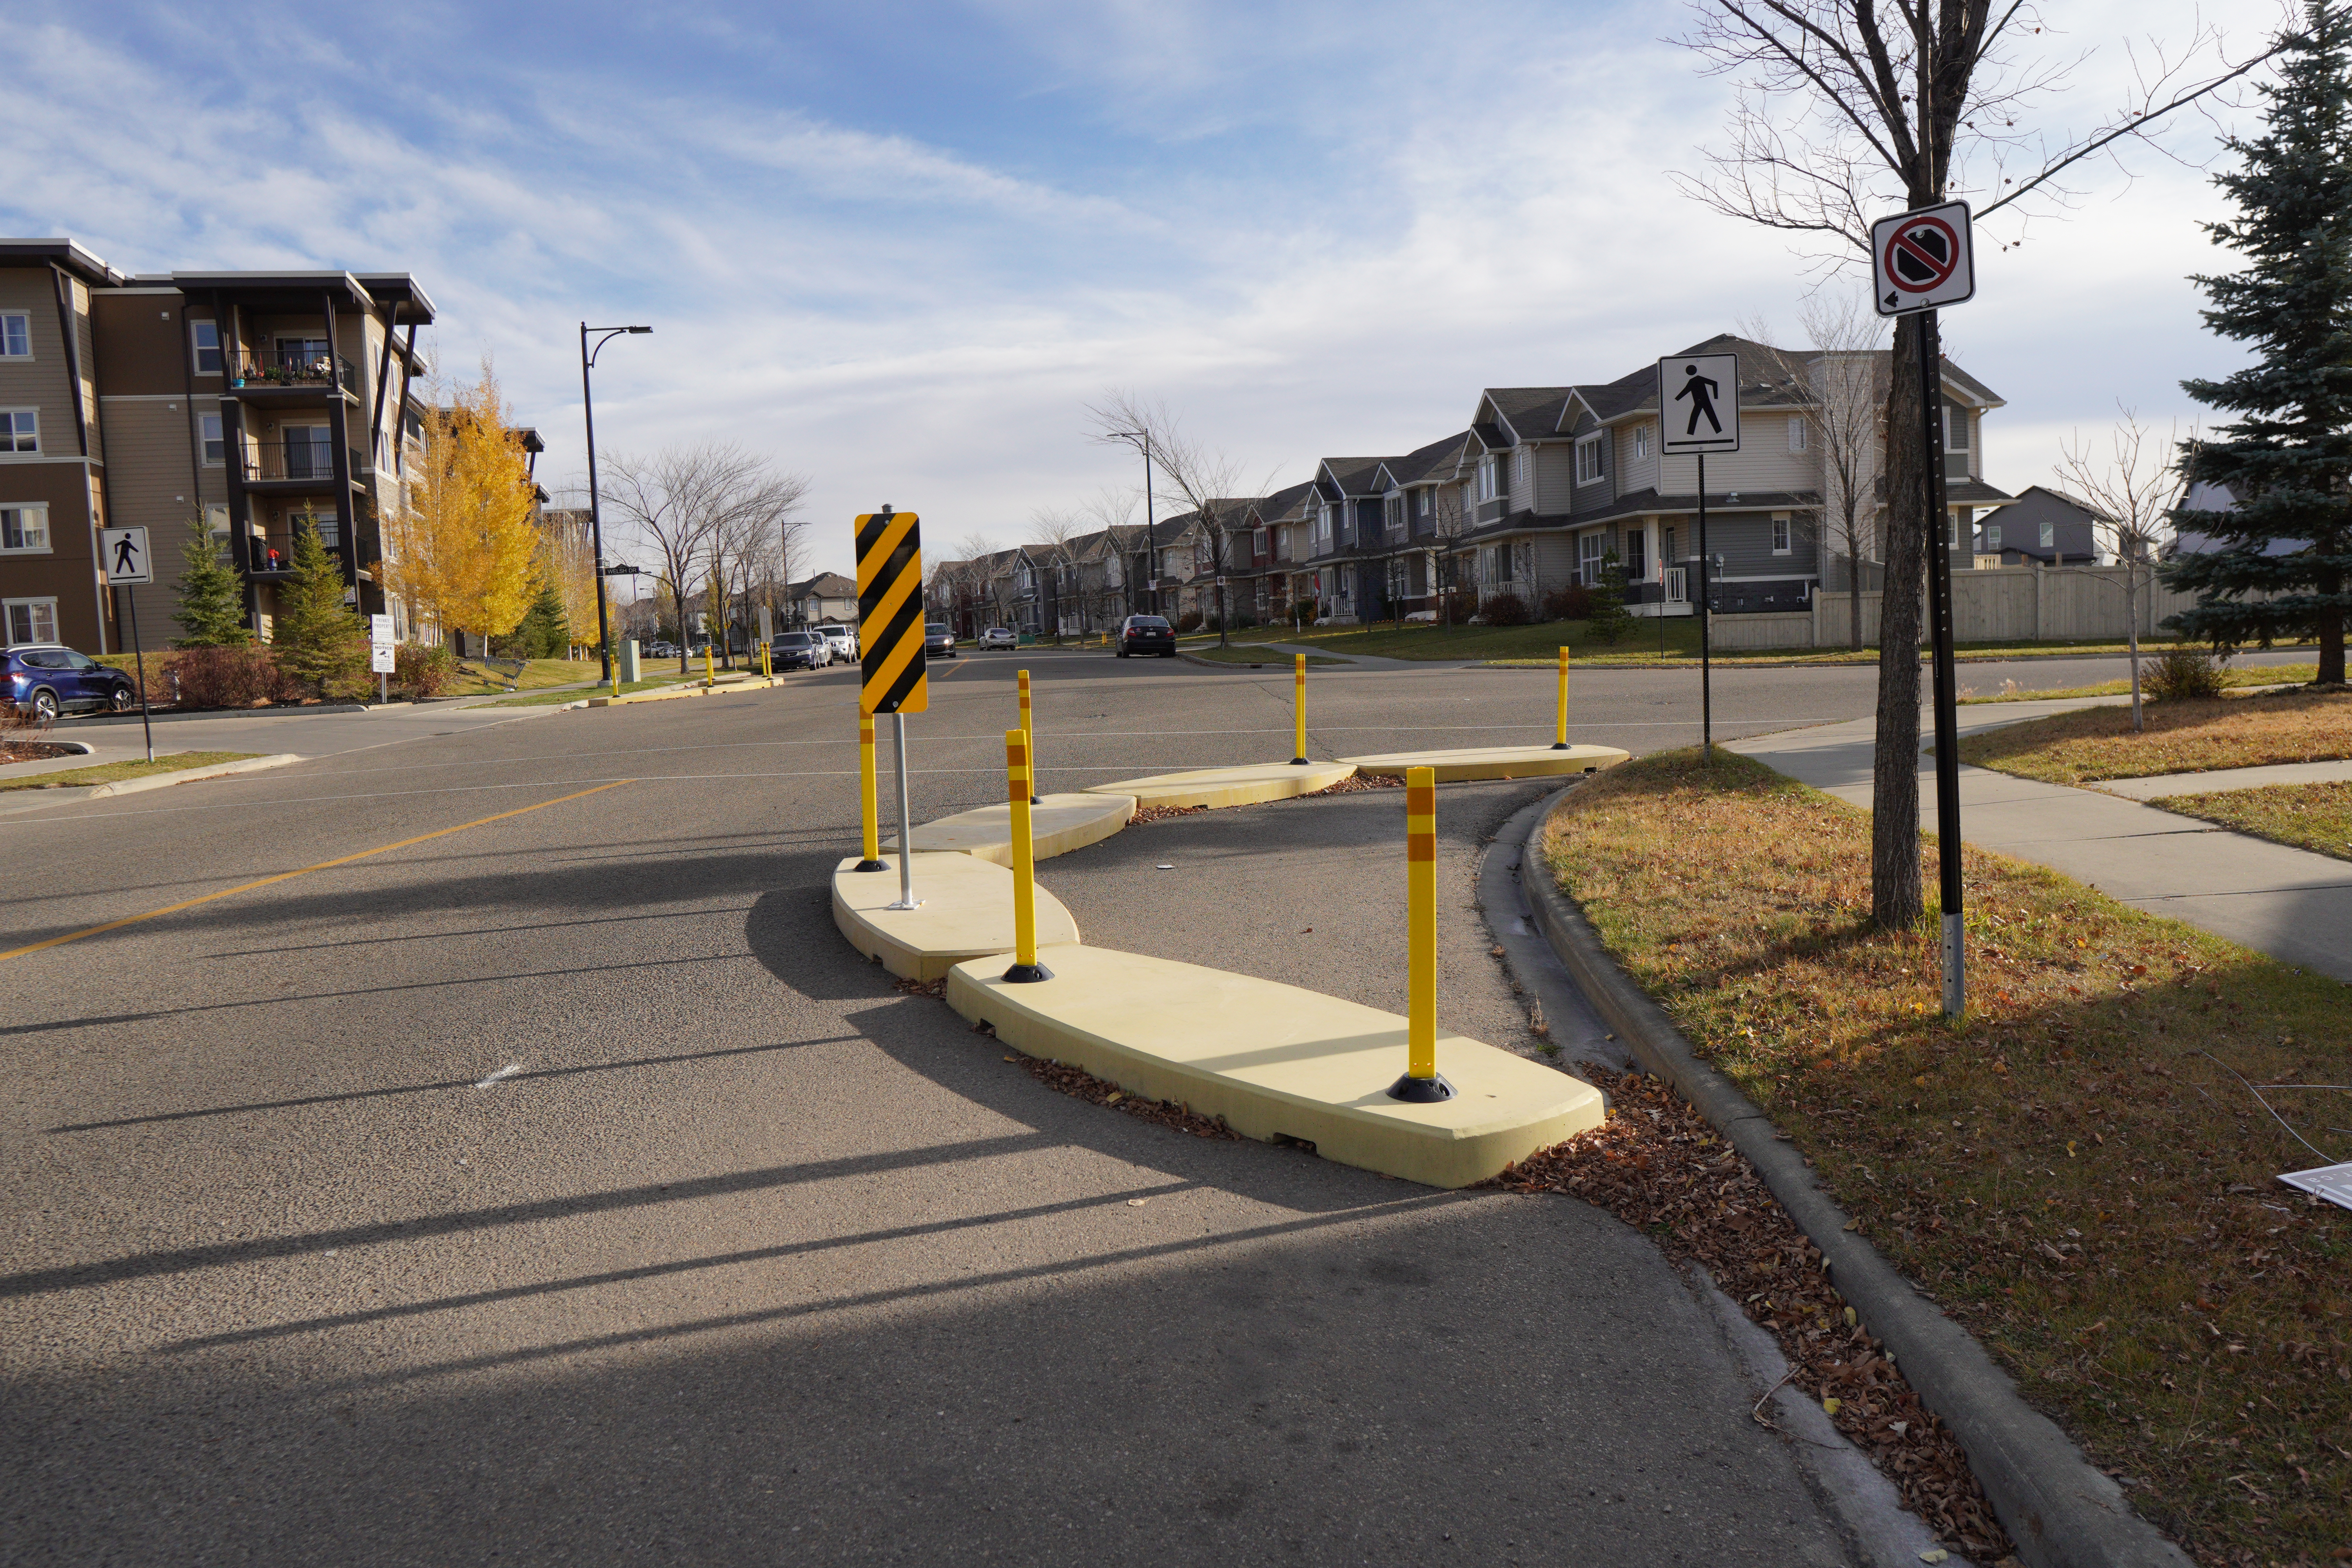
The key to this success? Data. By analyzing where, how and why collisions occur, as well as improving how data is shared across departments, Edmonton has identified and tackled collision hotspots with targeted solutions. For example, 74% of crashes resulting in fatal and serious injuries for a pedestrian were found to result from drivers failing to yield at intersections. To address this, the City has completed over 560 Safe Crossing projects since 2015, with 200 more planned for 2026. These include implementing a wide variety of safety updates such as pedestrian scrambles that halt all vehicle traffic and allow pedestrians to cross diagonally, pedestrian activated signals and curb extensions, all of which have drastically reduced intersection collisions. Residents can track progress on the Safe Crossings Dashboard.
Improving crossings is just one part of Edmonton’s data-driven Safe Mobility Strategy. In 2021, the City lowered the default speed limit to 25 mph (40km/h) on residential, downtown and high-pedestrian streets. Data showed the change would only add a minute or two to commutes while significantly improving safety, helping to gain public support. To implement the change, the City installed 1,508 signs and launched an Estimated Time of Arrival Tool, allowing residents to see how the new limits affect travel times. Within four months of enforcement, 88% of drivers were complying with the new speed limit.
560 intersections have been made safer for pedestrians since 2015.
While Edmonton and many cities across North America have seen a rise in fatalities following the pandemic, Edmonton’s Vision Zero foundation enables the City to better understand the underlying causes to make data-informed safety decisions. Additionally, as Edmonton plans for 2 millions residents, the City is integrating traffic safety into urban planning and aligning Vision Zero with broader priorities like transit, climate resilience and community health, Edmonton is creating a vibrant, sustainable city where people can thrive.