Boise, Idaho, USA

Recycling Wastewater to Build a More Resilient Future

Project Type:
Communications, Community Engagement, Infrastructure and Utilities

At a Glance


$570 million: Bond amount voters approved with 81% support in November 2021, funding Department of Public Works Water Renewal Services projects slated through 2030. 


50+: Number of open house events held at the city’s water recycling pilot site


6 million gallons: Amount of additional water Boise will add to its renewal capacity each day when fully its Recycled Water Program is implemented, strengthening the city’s resilience against drought, population growth and climate change.


2029: Year the brand-new water recycling facility is slated to open.

In Boise, climate change and population growth all pose a long-term challenge to the most precious natural resource: water. The city of about 247,000 people draws 70% of its water from aquifers and 30% from the Boise River. Both water sources are under growing stress due to rising demand for irrigation, shrinking snowpack and increasing drought frequency.

To build resilience and support growth, the City of Boise has embraced water recycling. In 2020, the Department of Public Works’ Water Renewal Service utility issued a data-driven strategic plan to ramp up Boise’s water recycling capabilities over the next 10 years, with a new focus on aquifer recharging. A centerpiece of the plan is construction of the city’s first recycled water facility.  

City leaders have worked to rally Boise residents around their vision to ensure an adequate supply of water for both residential use and new businesses. They built buy-in various ways. The City held over 50 community meetings to show trade-offs of water treatment models to address limited water supply. The result was a $570 million bond measure that passed in 2021 with voters’ overwhelming support (81% voted in favor). This allowed the City to move on major water renewal capital projects, including a new $420 million water recycling facility, with minimal sewer user fee increases.

Leaders also leveraged the annual budgeting process to build stakeholder support. In recent years the City’s budget has included tens of millions of dollars in water renewal capital project investments, including for an advanced water treatment pilot to test new technologies. The pilot site, which opened in 2023, tests five different filtration technologies including reverse osmosis and ultraviolet advanced oxidation, to remove all chemicals and pollutants from industrial wastewater. Notably, one goal for data from the pilot is to build trust with residents.  The City aims to show that the recycling treatment will produce safe water for the community. 

As Boise city officials and residents deepen their knowledge of innovative filtration technologies, which aren’t common in Idaho, a more resilient future is coming into view. In February 2024, the City purchased a 76-acre plot of land where it will build the new state-of-the-art recycled water facility. Construction will start in 2025, a key step toward a more sustainable Boise.

The WWC team at the Boise water facility.

“The open houses we’ve done with community engagement of this pilot, the ability to show people the technology and talk about it, is really incredible.”

Haley Falconer, Environmental Division Senior Manager, Public Works Department
Join Our Certified Cities!

Sugar Land, Texas, USA

Where Data and Curb Appeal Aim to Make a Stronger City

Project Type:
Community Engagement, Equity, Health and Wellbeing, Technology

At a Glance


Used the Neighborhood Health Report, which included GIS data on population stagnation, aging housing and code violations, to create a home renovation program which targeted investments of over $2.7 million to upgrade 166 Sugar Land homes (145 projects have been completed.)


95% of participants said the program significantly influenced their decision to renovate their homes.


Redevelopment is one of the city’s “All-In” Initiatives using cross-departmental collaboration and performance management to make progress on complex challenges.


Another All-In Initiative is to increase the City’s data-driven decision making and is led by a four-person “What Works Cities team”

Neighborhood blight is not something you hear much about in Sugar Land, a prosperous suburb that frequently ranks near the top of “best places to live” lists. And city leaders want to keep it that way.

But here’s the challenge: The first wave of subdivisions that began Sugar Land’s transformation from small town into a city of 110,000 are reaching middle age. Some of the homes built in the 1970s and ‘80s are starting to look rough around the edges. Property values are linked to a city’s economic health. Declining property values can discourage community investment, reduce revenue for the City and make it hard to attract new residents. 

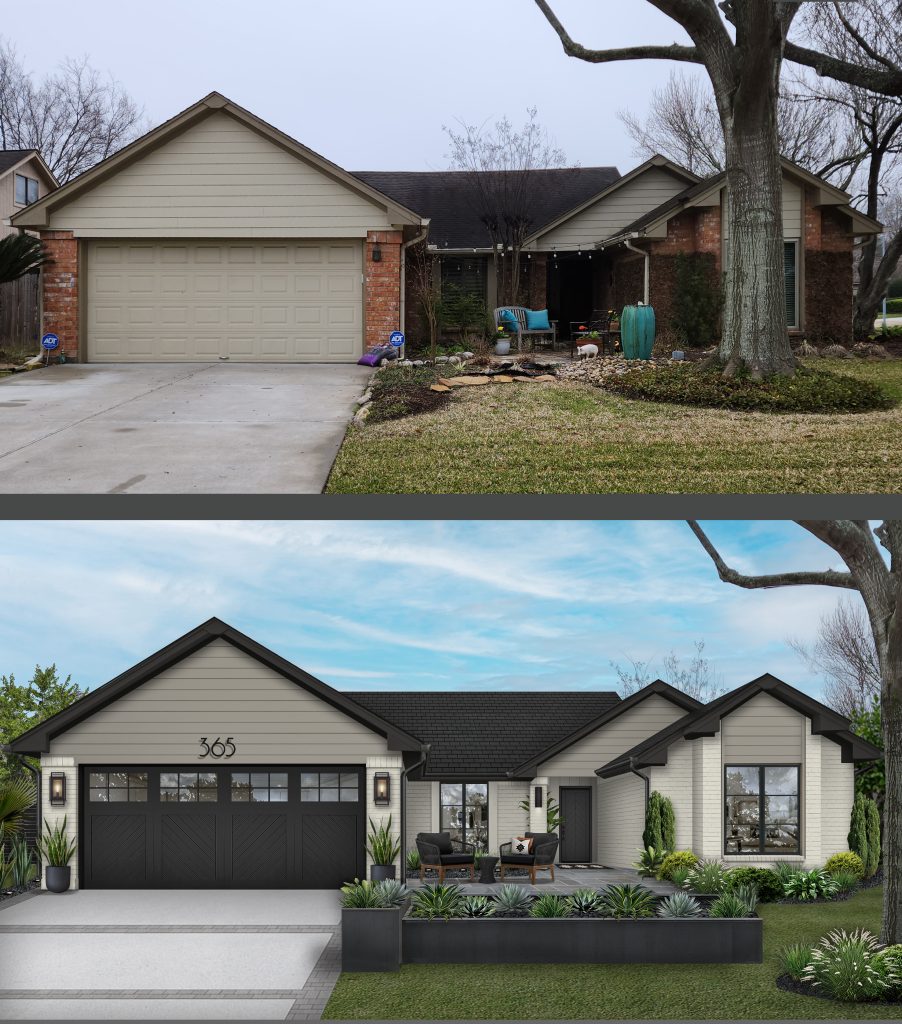
In response, Sugar Land recently launched a successful program called Great Homes Update. It encourages homeowners to take on external home upgrades like painting, garage door replacement, or driveway repairs. And it’s built from top to bottom on data that city leaders used to understand the problem, rally political support, and devise a solution that meets residents’ needs.

Great Homes is one product of what Sugar Land leaders call their “All-In” initiatives. These are cross-departmental collaborations aimed at using a performance management approach to make progress on complex challenges. Redevelopment in a mostly built-out city is one of those All-In initiatives. Improving data-driven decision making through What Works Cities coaching is another. 

To start, leaders conducted a neighborhood health report, mapping the age of homes across the city and where the most code violations were happening. They also sent staff out to different neighborhoods to do a qualitative assessment of the conditions of homes’ roofs, fences, and driveways. 

Next, they surveyed residents to make sure they understood the problem from the homeowners’ perspective. Residents confirmed that they would, indeed, implement improvements if a financial incentive were available. Before designing a pilot program, city leaders looked at how home-improvement programs work in 22 communities across the U.S. Their efforts to find evidence-based solutions in other cities paid off: The pilot they devised won nearly unanimous support from the City Council in February of 2023.

An example of the potential impact of exterior home renovations supported by the Great Homes program. Images Courtesy of the City of Sugar Land.

Through the program, owners of single-family homes are reimbursed for a portion of the cost of exterior house repairs, up to a maximum of $10,000. The City gave a higher rebate percentage to older homes and homes with less than the county’s median home value. .Another program offers owners of single-family houses and homeowner associations discounts on home design services. To make it easy for residents to find out exactly what benefits they’re eligible for, the City developed an easy-to-use address lookup tool based on resident feedback. 

Results from the first year of Great Homes were impressive. Homeowners carried out more than 145 home projects, including house painting, repairs to roofs and siding, and landscaping. The total of all repairs incentivized through the program was $2.3 million, with about $500,000 of that coming from city coffers. In follow-up surveys, users of the program overwhelmingly agreed that the City’s reimbursements influenced their decision to make home repairs. 

City leaders continue to use data to evaluate and improve Great Homes. Under a new iteration of the program, the list of eligible projects has expanded to include front door and gutter replacement.

In the long run, Sugar Land hopes the program will help make the City competitive with nearby areas and deter decline, helping to sustain a prosperous Sugar Land.

“What Works Cities Certification gives our organization a beacon to show: This is where we’re going and this is how we’re going to do it. We don’t need to create our own playbook.”

Mike Goodrum, City Manager
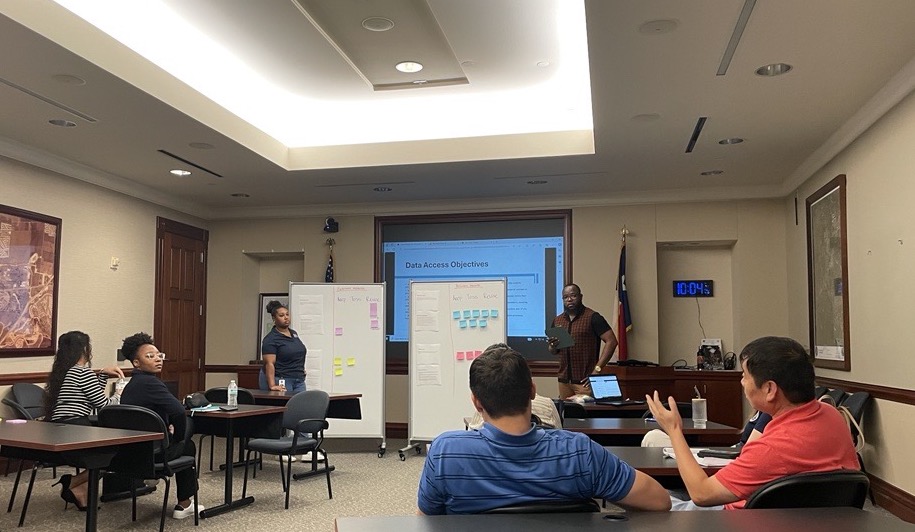
A data strategy brainstorming meeting. Image Courtesy of the City of Sugar Land.

“It’s a community effort that the program is inspiring. Keeping our neighborhoods in good shape is very important for the community.”

Joel Sanchez, Sugar Land resident and Great Homes participant

Residents leveraged about $500,000 in City funds to make more than $2.3 million worth of home improvements.

Join Our Certified Cities!

Dallas, Texas, USA

An All-In Approach to More Equitable Budget Decisions

Project Type:
Community Engagement, Environment, Health and Wellbeing, Transportation

At a Glance


Used disaggregated data to drive budget decisions that address inequities based on race and/or income. All 42 city departments contributed to the establishment of over 220 metrics that are tracked publicly through the Racial Equity Plan, of which $40 million was allocated towards equity investments.


Launched the first Spanish-language 311 mobile app of any big city in Texas.


Reduced the number of steps in the procurement process from 82 to 23, speeding up the time it takes the city to purchase goods and services.

City leaders in Dallas know that if you want to get something done in local government, the budget is a good place to start. So when they took on the goal of creating a more equitable city, that’s exactly what they did.

The result is a process Dallas calls Budgeting for Equity. Rooted in sophisticated data practices, it’s one of the most robust City Hall systems in place anywhere for identifying and addressing disparities.

The effort began in 2019, with publication of the Dallas Equity Indicators report. The report measured equity across 60 social and economic indicators, from business ownership to home loan denials to kindergarten readiness. It also provided baseline data for local leaders to track citywide equity changes over time.

Next, eight departments used the equity indicators to identify disparities and change budgets to address them. For example, the 311 customer service center noticed that wait times were longer for Spanish-speaking residents. In response, the department hired bilingual staff and recently became the first big city in Texas to launch a Spanish-language 311 mobile app.

Budgeting for Equity has since expanded across all of city government. It’s led by the Office of Equity & Inclusion –in collaboration with the Office of Budget Management Services which guides the City’s 42 departments as they use a tool the Office created to help them prioritize equity in their budgets. Departments are required to use disaggregated data so they can spot disparities within the services they provide by race, ethnicity, age and other factors. They also must consider how their budgets may produce both positive and negative impacts in communities of color and lower-income neighborhoods.

“It’s easy to talk about the ways we’re helping people,” says Dr. Lindsey Wilson, Dallas’ Director of Equity & Inclusion. “But how are we also burdening communities? We need to not only talk about the good things but also the not-so-good things that data is telling us.”

What makes Dallas’ efforts stand out from what other cities are doing is its thoroughness. Budgeting for Equity is not an occasional activity for a handful of departments at a time — in Dallas, every department does it every year. The process is aligned with a comprehensive Racial Equity Plan the City Council adopted in 2022, which includes a set of “Big Audacious Goals” meant to guide implementation of that plan; progress is continually tracked in a public dashboard. Individual departments in charge of libraries, arts and culture, planning, and water, have earned recognition from their own industry organizations. 

“Each year we hear from departments about adjustments we need to make,” Dr. Wilson says, noting that the number of questions departments are asked to answer through Budgeting for Equity has been reduced from ten to five to reduce burdens on them. “The one thing that never changed was the use of data to drive the outcomes.”


60 citywide measures included in Dallas’ Equity Indicators Report


3,203 individuals and 284 organizations were directly engaged in creation of the Racial Equity Plan.


5 “Big Audacious Goals” in the Racial Equity Plan

“If we continue to strengthen and hold ourselves accountable for this work, we should see disparities decrease and begin to see transformative change.”

Dr. Lindsey Wilson, Director Dallas Office of Equity & Inclusio
Join Our Certified Cities!

Issaquah, Washington, USA

Data Helps Issaquah Close Gaps in Homeless Services

Project Type:
Community Engagement, Equity, Housing

At a Glance


Staff from the City’s Homeless Outreach program had 1,555 interactions with unhoused community members between September 2021 and January 2024. On average, it takes four to five interactions with a person before they consider accepting services.


Created and launched Data Quah, a data training program for staff. All new hires participate in Data Quah 101 to learn about the City’s data collection and tracking systems. Over 50% of staff engaged with Data Quah in its first year.


Monitored crime trends and partnered with local businesses to gather and share data. In 2023, burglaries fell by 37% and thefts by 26%.


Using data to show how investment in the arts promotes tourism and economic development. The City tracks requests for arts grants, providing insight into community-wide needs and allowing for more strategic funding decisions. (Jakob is a city art highlight.)

Staff from the City of Issaquah’s Human Services team first met John in September 2021. At the time he was camping under bridges and had been homeless for four years. It took repeated meetings to build enough trust with John to begin the process of finding him a permanent home. With the help of the City, federal rental assistance and family, John moved into an apartment in March 2022. 

John is one of 37 people the City has helped move into permanent housing since it began its Homeless Outreach Program in June 2021. It has also provided unhoused community members with over 1,000 connections to services, such as temporary shelter, transportation and medical treatment. 

The Homeless Outreach Program started with a goal of filling information gaps about homelessness in Issaquah. Data collected by the Human Services team showed that homelessness was more prevalent than originally thought, and that shelter, treatment and affordable housing were needed in Issaquah. These findings were incorporated into the first-ever Human Services Strategic Plan, which includes goals and action steps for effectively responding to homelessness. In 2022, the City began using an online dashboard to track data from the Homeless Outreach Program and share timely updates with the community. 

“We’ve got some good data over time. But are we really able to tell that we got the outcome that we were trying to? Not just that we tried, but that we moved the needle.”

Mayor Mary Lou Pauly

Trends emerged from the data. Because Issaquah didn’t have an emergency shelter, people had to leave town for a bed, something many did not want to do. Even when they were willing to accept shelter, 43% of the time no beds were available in the regional shelters. To fill the need, the Homeless Outreach Program began collaborating with a local hotel franchise to provide emergency shelter during extreme winter weather.  

The initiative was modeled on a successful hotel-based emergency shelter program King County ran during the pandemic to reduce the spread of COVID-19. Human Services staff found that people were more likely to accept shelter in a motel room in Issaquah during extreme weather than other shelter options. The stability of the motel also allowed staff to engage more consistently with individuals, build trust faster and make quicker progress on service goals.

Seeing the positive outcomes, the City proposed expanding the collaboration with the motel beyond short-term shelter and into emergency housing. Data gathered from the homeless outreach encounters led to the City Council’s approval of a pilot program. The pilot program dedicated 12 rooms in the motel to supporting community members as they move from homelessness to permanent housing. The Human Services team, in partnership with the City’s Performance Program Analyst, will continue to collect and analyze data, look for trends, and evaluate whether their approach is alleviating homelessness in Issaquah.

1,073 connections to services, including temporary shelter, basic needs and transportation

From left WWC’s Emily Ferris, Issaquah’s Assistant to the City Administrator Dale Markey-Crimp, and WWC’s Jake Hemphill in front of Issaquah’s troll, Jakob Two Trees. Jakob is one of six trolls that form a large-scale public art installation.

“I was approved for a voucher to find housing. They did that for me!! The City of Issaquah rescued me but that’s only part of it. The man, Amir, who helped me went above and beyond the call of duty. He drove me places to apply, he paid deposits and holding fees. He started out as a case manager, but I consider him my friend.” 

John, Issaquah resident who experienced homelessness

Join Our Certified Cities!

Port St. Lucie, Florida

Residents Tag Mobility as Priority. Port St. Lucie Uses Data to Deliver.

Project Type:
Community Engagement, Infrastructure, Public Safety, Transportation

At a Glance


In 2023, launched a newly formatted Port St. Lucie Stat program, moving from an annual review of operations to quarterly reviews. 


Collects resident input through an annual Citizen Summit and National Community SurveyTM.


In response to resident demand for better mobility options, the City  developed and found funding streams to support a Sidewalk Master Plan, Multimodal Plan and Mobility Plan.


Anticipating new jobs bringing over 9 million sq. ft. of new office, retail, research and industrial developments, the City created a jobs corridor with public art and green space requirements.

Port St. Lucie is one of the fastest growing cities in the country, adding more than 35,000 new residents in the past three years. This rapid growth comes with benefits and challenges. But, with the help of data and resident input, the Mayor, City Council and staff are successfully managing today’s growth and planning for the future. 

At the heart of their efforts is Port St. Lucie’s strategic plan. First developed in 2013, the plan is updated annually to reflect residents’ priorities as gathered at the #IAMPSL Citizen Summit and through a National Community Survey(NCS)TM. The City strives to make the Citizen Summit fun and easy for residents to attend – approximately 800 people came in 2023. The NCSTM takes a different approach for reaching residents. Run by the National Research Center at Polco, the survey is sent to a scientifically random sampling of households. 

For several years now, residents have made it clear – at both the Citizen Summit and through the NCSTM – that improving mobility around the city should be a priority. In 2023, only 4 in 10 residents said it was easy to walk around the city and even fewer thought it was easy to bike or use public transit. These findings are not necessarily surprising. Port St. Lucie was developed as a retirement community in the 1960s and included few sidewalks. But, in line with resident feedback, the City has made adding more sidewalks a key infrastructure priority in its strategic plan. 

In 2017, the City Council approved an enhanced  10-year Sidewalk Master Plan to add 35 miles of sidewalks, particularly on streets within a two-mile radius of schools, and to create a network of connected sidewalks. Progress on the plan has been helped by a resident-approved half-cent sales tax increase for infrastructure projects. As with its other strategic goals, the City tracks its performance on the Sidewalk Master Plan on a public dashboard. It also recently revamped its Port St. Lucie Stat program to meet quarterly and to align with best practices on strategic planning and establishing performance metrics. This allows the Public Works and Police Departments to better collaborate on mobility solutions in response to traffic data. The Police Department also has a Stat program in place as part of their data-informed approach.

In 2022, the City installed 4.9 miles of new sidewalks and repaved 49.94 miles of roads.

And the City has not stopped with the Sidewalk Master Plan. In 2021, it began exploring multimodal planning as a way to increase sidewalk connectivity, expand transit coverage, reduce congestion, and accelerate street repairs and improvements. State legislation allows local governments with multimodal plans to collect flexible mobility fees on new developments instead of road-specific impact fees. The City adopted both a Multimodal Plan and a Mobility Plan in order to access this flexible funding. As of September 2023, the City had collected $22 million in mobility fees to invest in projects that will have the biggest impact for current and future residents. 

“The City of Port St. Lucie has a strategic plan to bring the City towards an even better future. Each year, our nationally award-winning planning process begins with listening to the input and ideas of Port St. Lucie residents. Through this process, residents can truly help shape the future of their City.”

Kate Parmelee, Deputy City Manager for Strategic Initiatives & Innovation

“Basically everything we do here is based on our strategic plan.”

Shannon Martin, Mayor

According to the U.S. News & World Report #2 safest city to live in the U.S.

Join Our Certified Cities!

Rock Hill, South Carolina, USA

Public Transportation Steered By Data

Project Type:
Community Engagement, Environment, Health and Wellbeing, Transportation

At a Glance


The percentage of residents who report using public transportation has more than doubled since their fare-free, all-electric public buses began in 2019.


More than 700 alumni of a 10-week civics course provided to residents by the City.


Increasing tree canopy by planting three trees for every one tree the City cuts down.

Rock Hill, SC, tried public transportation in the 1990s. It wasn’t a roaring success; people didn’t know about it and ridership was low. However, in 2015 a Winthrop University survey found that 80% of respondents identified transportation as a top need. With that data point, Mayor John Gettys knew it was time to give public transportation another go.

Data was a guiding force from the start. The City paired the survey with qualitative data from focus groups that also said fixed-route transit would minimize barriers and provide opportunities to residents. With the need established, choosing routes and schedules were the next items on the agenda. Again, the City leaned on resident feedback, partnering with United Way to hold interest meetings. At the same time, regional planning associations used census data and maps to plot routes that would most benefit residents who needed it most. For instance, they didn’t just look at neighborhood density, they looked at where residents without cars lived, and they made sure that routes passed parks, shopping centers, health care facilities and other places residents recommended.

Image Courtesy of the City of Rock Hill.

“The reason we accomplish big things is that we use data to drive decisions, something the City has done consistently over the last 20 years. I think being strategic and utilizing data to solve challenges attracts good representatives who want to come in and do big things, good things for our community.”

John Gettys, Mayor

“Basing decisions on data can minimize the vitriol of partisan politics, it’s an antidote to a lot of the divide we see in our country today.”

John Gettys, Mayor

My Ride not only improves accessibility, it’s making a more sustainable Rock Hill. The fleet of 10 buses are all electric and produced in South Carolina. The buses reduced about 337 metric tons of CO2-equivalent emissions compared to diesel buses in just their first year, they’re also quieter for riders and cost less to operate.

Data guided My Ride’s funding decisions as well. Evidence showed that it was cost-prohibitive to collect fares, and city leadership knew how much the buses contributed to accessibility. Thus, the buses are fare-free. Federal Transit Authority (FTA) funds help meet the majority of the costs, the rest is covered by the City and partner organizations.

As My Ride’s success grows, so too do the City’s ambitious goals for the bus system. When the program started, their ridership goal was 4,100 passenger trips per week—a goal they met in less than two months. Despite the plunge in ridership due to the pandemic, ridership has bounced back. In FY23, My Ride’s monthly ridership goal was 16,400. They averaged 20,839 passenger trips per month. And they did all of those rides with only three customer complaints the whole year.

This isn’t the end of the line for My Ride. The four, hour-long routes already serve about two-thirds of city residents, and the City is constantly collecting feedback and setting goals for improvement. For example, in 2023 My Ride began to serve additional areas on the existing routes and improved system efficiency.

Join Our Certified Cities!

Alexandria, Virginia, USA

Data & Community Partnerships Key to Addressing Evictions in Alexandria

Project Type:
Community Engagement, Equity, Housing

At a Glance


Developed an automated system for gathering information on eviction court proceedings. The data informs the efforts of the Eviction Prevention Task Force, a City-community partnership that supports households at risk of eviction.


Since the CDC moratorium ended in August 2021 to the end of 2023, 7,968 evictions have been filed in Alexandria. With support provided by the Task Force and other community partners, only 1,018 of those evictions resulted in a resident being removed from their home.


An independent evaluation of the Alexandria Co-Response Program (ACORP) found that when its teams of trained law enforcement officers and behavioral health clinicians responded to 911 calls that could have resulted in arrests, 70% were diverted from legal action.


Launched an Equity Index Map in 2023 to identify disparities in key social and economic outcomes and to help city staff and community partners make equitable, inclusive and data-driven decisions.


Maintains 92 datasets and dashboards that track how well City programs are working, provide transparency to the community, and help inform collaborations with residents and stakeholders.

Housing affordability has been a priority and a work in-progress for the City of Alexandria for over a decade. Even before the economic volatility of the pandemic, 89% of renters earning $50,000 or less were housing cost burdened and paying over 30% of their incomes in rent. When the pandemic hit, many of these households had little financial buffer.

Hoping to stem a tide of evictions, legal and housing advocates across the city jumped into action. Rather than duplicate the work of local organizations, in June 2020, the City formed an Eviction Prevention Task Force to bring together local nonprofits, faith organizations, and City departments to share information and coordinate efforts.

“We have boots on the ground. We are triaging emergencies. This partnership with the City and faith-based community and nonprofits is unique to Alexandria,” Mary Horner, a housing attorney for Legal Services of Northern Virginia, said in July 2020. “It is the benefit of our size and our tight-knit community. Everyone is on the same team.”

One strength, in particular, the City brought to the partnership was in data collection and analytics. Legal Services of Northern Virginia had been collecting publicly available data on eviction proceedings from the Alexandria General District Court to guide outreach efforts to at-risk households – but that data collection was taking hours each week. The City’s Office of Performance Analytics (OPA) used funding from the American Rescue Plan Act to hire a data analyst to work with the Task Force. The analyst assessed the situation, built a web scraper that reduced the weekly data collection process to a few minutes, and developed a dashboard to follow trends and changes in the eviction landscape.

“We have boots on the ground. We are triaging emergencies. This partnership with the City and faith-based community and nonprofits is unique to Alexandria. It is the benefit of our size and our tight knit community. Everyone is on the same team.”

Mary Horner, Housing Justice Senior Staff Attorney, Legal Services of Northern Virginia

Coordinated, data-based outreach efforts by Task Force partners paired with state and local rental assistance proved incredibly effective in preventing evictions. Between June 2020 and September 2021, City departments helped 3,717 households secure city and state rental assistance.  In 2021, control of rental relief funds transitioned from local government to state government. From January 2021 to December 2023, Legal Services of Northern Virginia – with financial support from the City – provided legal assistance to over 3,500 people through courthouse outreach, representing 17% of tenants facing eviction.

The Task Force’s role has evolved with the changing eviction landscape. Pandemic-era federal and state eviction moratoriums and rental assistance programs have ended, yet evictions legally served to tenants are still below pre-pandemic levels. But the approach of using data and partnerships to improve housing stability is still producing positive outcomes. For example, when a state rental assistance program ended in 2022, a local church asked how much it would cost to stop evictions for the remainder of the year. Using data on the average amount of unpaid rent, the Task Force could answer and the church donated the money.

The City of Alexandria’s strong data foundation and investment in staff capacity made it a productive partner in the Eviction Prevention Task Force, helped bring housing stability to thousands of residents during the pandemic, and are informing the City’s ongoing efforts towards increasing housing affordability.

“The [Eviction Prevention] Task Force has done an impressive amount of work and, as you can see in the numbers, it’s making results. During the pandemic I saw a report that suggested that Virginia had the highest rate of any of the states in allocating federal rental assistance funds. That’s impressive for the entire commonwealth, but I would argue that it’s our efforts in Alexandria that probably made most of that happen.”

Mayor Justin Wilson

Join Our Certified Cities!

Rochester, Minnesota, USA

Breaking Down Barriers to Build a Diverse Workforce.

Project Type:
Community Engagement, Finance, Health and Wellbeing, Infrastructure, Public Safety, Transportation

At a Glance


Among 631 entries from around the globe, Rochester was one of only 15 cities to be awarded a $1 million grant from Bloomberg Philanthropies’ Mayors Challenge in 2021.


Established Equity in the Built Environment, a flagship program to increase workforce participation for women of color in built environment industries

Overall, Rochester, MN’s poverty rate is part success story, part call for action. The city’s 7.4% poverty rate is well below the national average of 11.5%. But equity is top of mind for city leaders, and when they dug deeper to examine who in their community are struggling, they found an alarming disparity. Four in ten Black Rochester residents live in poverty—far above the citywide rate and more than double the national poverty rate for Black Americans. City leaders recognized addressing such a large disparity required a new way of thinking and fundamental changes. 

In 2020 the City of Rochester named Chao Mwatela as the first Diversity, Equity and Inclusion Director. Instead of coming in with a laundry list of action items, she began by identifying potential priority areas using disaggregated data. Then, Mwatela focused on building relationships and listening. She spent time learning about past equity efforts and made recommendations based on what she heard from residents, City staff, and community organizations. A consensus emerged that in order to create a more equitable Rochester,  intentional engagement of the community members most impacted should take priority—this practice is a critical component of WWC Certification.

Also in 2020, the City participated in the Bloomberg Global Mayor’s Challenge which asked cities to identify new solutions for a persistent problem in their city. Rochester identified a problem and an opportunity – inequitable access for women of color to well-paying built environment careers. Nationally, women occupy about one in 10 construction jobs. In Southeast Minnesota, women of color are employed in less than 2% of built environment careers yet represent 13% of the population. As home to the renowned Mayo Clinic, Rochester is undertaking a $5.6 billion public-private economic development plan to elevate the city and solidify its standing, globally, as a leader in healthcare and medical research. Community groups, City leaders, and DMC stakeholders recognized that intentional growth should prioritize equitable results, so everyone in the community benefits. One opportunity, made clear by the data, is for Rochester to recruit more women of color in built environment careers to meet these ambitious construction plans.

Together–using a co-design methodology–women of color and built environment professionals, along with representatives from Rochester Schools, Workforce Development Inc, and the City of Rochester created the Equity in the Built Environment program.

The program includes:

  • K-12 career exploration,
  • Training and mentorship for women of color,
  • Inclusive Workplace Employer (I/WE) designation for built environment employers hiring from the program, and
  • Entrepreneurship support for women of color starting a built environment business.
Photo Courtesy of the City of Rochester

Their efforts have been recognized. In 2021, Rochester was one of 15 global cities to receive a $1 million grant as part of the Bloomberg Philanthropies Mayors Challenge. Their award is focused on building a system that creates access to women of color into built environment careers. This system consists of education, workforce development, trades unions, and private employer partners all working in collaboration to ensure success for women of color. As of January 2024:

  • Four commercial construction companies earning their Inclusive Workplace Employer designation.

  • Thirteen women involved in built environment training or entrepreneurship .

  • Over one hundred 11th grade students were exposed to built environment careers through experiential learning economics curriculum.

  • A built environment framework now supports women of color on their chosen career path from training to employment and beyond.

 More than anything, Rochester’s data story is about using data to see innovative ways to solve problems and create opportunities. It’s about economic growth being a benefit for all residents and a catalyst for equity. While the program is early in the implementation phase, it’s poised for success. By developing solutions with residents, the City has used data to create pathways to high-paying careers, enhancing economic mobility for historically marginalized communities.

“Aggregate data is meaningful, but does not tell us the stories and experiences of specific communities – those most impacted in our communities. It is imperative that we disaggregate data to understand impacts to specific groups and communities.”

Chao Mwatela, Diversity, Equity and Inclusion Director

“What Works Cities Certification shows the community that our staff are not only trained and certified in the use of data, but that we’re actually using data to make progress and being recognized for it. In a time of widespread distrust of government, having What Works Cities Certification is a chance to increase trust in government.”

Kim Norton, Mayor

Join Our Certified Cities!

New York City, New York, USA

A Data-Driven Process to Reach Net Zero Emissions: Climate Budgeting

Project Type:
Health and Wellbeing, High-Performing Government, Youth Development

At a Glance


100% of City agencies have already submitted emissions impact data with all capital project budget requests


April 2024: When NYC will publish its first Climate Budget.


$4 billion: Amount the City will invest in a school electrification plan, which will contribute a 3% reduction in greenhouse gas emissions from government operations.

Climate Budgeting to Help Reach Zero Net Emissions

New York City has a goal to reach net-zero emissions citywide by 2050.

To reach that goal, city leaders must put data at the heart of day-to-day operations. One way the City is doing this is through a new municipal climate budget. As part of the climate budget, the City bolstered requirements for capital project budget requests to include projected emissions data, which are now being met by 100 percent of city agencies, contributing to a 27 percent reduction in greenhouse gas emissions from government operations.

“Climate budgeting is a significant shift in how we think about the value of tax dollars and their potential to power change. It’s the only way to use every budgeting decision to bring our climate ambitions to life. There’s no time to waste.”

Eric Adams, Mayor

Climate budgeting is a governance system that mainstreams climate targets and considerations into decision-making through the budget process and aligns the City’s resources with its climate goals. It is a paradigm shift from the traditional budget process to a holistic approach that considers the impact of every dollar the City spends on meeting its climate goals.

NYC’s climate budgeting is a core component of the City’s strategic climate plan announced in 2023 and is being led by New York City’s Office of Management and Budget, in partnership with the Mayor’s Office of Climate and Environmental Justice (MOCEJ).

An early example of climate budgeting can be seen in the “Leading the Charge” initiative, a $4 billion plan now in motion, to ensure newly constructed schools will be all-electric and 100 existing schools will begin to phase out fossil fuel heating systems. The initiative will prioritize schools in low-income as well as predominantly Black and Brown communities which are particularly vulnerable to environmental injustices such as elevated rates of childhood asthma. The electrification plan illustrates how NYC is using emissions data to combat climate change and disaggregated demographic data to promote equitable health outcomes.


How else has NYC become a more data-driven government?

As one of the first big cities in the U.S. to adopt climate budgeting, New York City is showing how new decision-making processes can deliver urgently needed change. 

In 2024, it will implement a formal climate budgeting intake form for agency budget requests and publish its first Climate Budget alongside the Executive Budget. The Climate Budget will include a citywide greenhouse gas emissions forecast showing progress toward the 2050 net-zero goal, as well as data that shows how capital project plans could affect climate goals such as air quality and heat and flooding resilience. The 100% compliance rate across departments is a positive sign for standardizing climate budget processes and understanding the City’s emissions.

Does climate budgeting make funding decisions more complex? Yes. But the initiative is worth it. It allows New York City to understand the climate impact of dollars spent and then rally around forward-looking projects aligned to must-reach goals.

“By using a data-driven decision approach, our administration is delivering results for New Yorkers in the most efficient and equitable way possible. Data is more than just a spreadsheet — it is a tool to help government better improve services that impact the daily lives of residents. I’m proud that New York City is recognized as an international leader in operations and look forward to continuing to use data to improve the lives of New Yorkers.”

Sheena Wright, First Deputy Mayor

Carlsbad, California, USA

Data and a Cross-Sector Approach Lead to Street Safety in Carlsbad.

Project Type:
Community Engagement, Finance, Health and Wellbeing, Infrastructure, Public Safety, Transportation

2024 Gold Certification


Carlsbad, California, achieved a 73 percent decrease in homelessness among veterans by leveraging data in new ways. A key to success was maintaining real-time personalized data on veterans experiencing homelessness, and using that information to catalyze collaboration among service providers to get veterans into permanent housing. The City also adopted its first “data service standard” aimed at making sure that new data products are designed to be as useful as possible for city leaders, residents, and others who may benefit.

2023 Silver Certification


Using road collision heatmaps and other data to inform interventions, the City saw a 19% decrease in all injury collisions.


Monitored progress and changed course when needed to achieve traffic goals using Performance & Analytics strategies.


City’s staff telecommuting policy reduced employee commute time by 47,000 hours and saved the City between $300,000 – $400,000. It has also improved traffic conditions for all city residents and eliminated 424 metric tons of greenhouse gas emissions.


Budget and finance processes require data and alignment with the city’s 5-Year Strategic Plan, to ensure funds are efficiently and effectively allocated to address the most important priorities of the community.

The number of collisions involving bikes and e-bikes was already surging in Carlsbad when, in August 2022, two bikers were killed during a 10-day period. The City had issued an ordinance on e-bike safety a few months before, but the tragedies and an alarming 233% increase in collisions involving bike and e-bikes between 2019 and 2022 promoted greater action. City Manager Scott Chadwick declared a 6-month local emergency, which was ratified by the City Council at its next meeting. The emergency allowed the City flexibility to move quickly and focus resources on encouraging everyone to be safer on the road.

Some residents worried that the emergency declaration would lead to less access for bikes or more traffic. But Chadwick was able to reassure them. “We’re going to let the data guide us,” he said. And that is exactly what they did.

Immediately after declaring the emergency, the City began gathering and analyzing additional data on collisions. They created heatmaps to identify the most dangerous intersections, did a 5-year trend analysis, and set up tracking for the future. Armed with data and streamlined procurement processes as part of the emergency declaration, the City was painting key intersections and bike lanes with high-visibility green paint within two weeks. In fact, they moved so fast that they exhausted the supply of green paint in the region.

Within 30 days of the emergency declaration, the City had a full plan in place for improving street safety. The Safer Streets Together Plan seeks to change public behaviors and attitudes by focusing on education, engineering and enforcement. “It wasn’t just, ‘Here’s an emergency.’ The public saw real things happening in the first weeks and months and that’s how this has changed things so quickly,” Chief Innovation Officer David Graham said.

Six months after declaring an emergency, injury collisions across all transportation modes were down by 19% compared to the same time period in the previous year, and injury collisions related to bikes and e-bikes had decreased 13%. Graham points to qualitative measures of success as well – street safety yard signs and car window clings on display throughout the community, residents saying they are wearing helmets and slowing down, and the city’s partnerships with schools and bike organizations.

Because of the positive trends and evidence of behavior change, in March 2023 the City Council voted to extend the emergency declaration for a few more months. City staff hope that a year’s worth of data and analysis will help build a sustainable approach to traffic safety and that the early positive trends will become permanent.

The traffic safety emergency is not the first emergency that Carlsbad has tackled with data-driven decision making. It took a similar and equally successful approach during COVID. Hopefully the City won’t have cause for testing its emergency response again anytime soon, but having a well-honed system for collecting and analyzing data, and for innovating and tracking outcomes means that no matter what the future holds, Carlsbad will be well prepared to handle it.

“To see transformation in government you have to invest in areas that aren’t readily apparent like data and analytics, process improvement and operational excellence. When we work together with our community to discover shared insights around issues like traffic safety, we can create impactful change.”

David Graham, Chief Innovation Officer

It’s not easy to change the way people behave on the road. Often, you’re trying to change habits people have had for years or decades, for better or worse. By taking a balanced approach to traffic safety and digging into the data, we can see what’s working and what isn’t working, and learn how to be more effective as we move forward.

Scott Chadwick, City Manager

Join Our Certified Cities!

Disclaimer