
Tempe, Arizona, USA


Project Type:
Communications, Cross-Sector, Health & Wellness, High-Performing Government, Infrastructure

2023 Platinum Certification

  • Launched Vision Zero, a data-driven traffic safety initiative with a goal to achieve zerofatal and serious injury crashes. The Vision Zero task force is composed of over 50 stakeholders including city departments (police, transportation, fire) and community stakeholders (Arizona State University, school districts, public health agencies) that conducted an analysis of crash data for the years 2012 through 2017. Using that data, the task-force created 37 transportation safety strategies, including the creation of four safety corridors based on statistical analysis of a higher propensity for collisions, plans for new road infrastructure, and community outreach plans.
  • Uses a performance-led budget process based on metrics, and resident and business satisfaction surveys. For example, following an increase in emergency service calls in the Salt River Bottom, an area with significant natural hazards and a large homeless population, an Incident Management Team was launched. In 2023, the City achieved several of its goals, including 66% of people engaged accepting shelter services and 52 tons of debris and over 3,200 tons of vegetation were removed. Based on these initial results, new, recurring funding has been allocated to support the City’s high priority “community health & safety” metrics.

2020 and 2021 Gold Certification

“I am enormously proud that our city has achieved Bloomberg Philanthropies What Works Cities Platinum status. This award shows our community that we are leaders in using data to guide our community’s future and make informed decisions. We can show people that our city has saved time and money and has been able to benchmark progress to our goals because of our commitment to data.”

Corey Woods, Mayor

Compiled data from the city’s sewage system monthly to track community drug use patterns and understand the depth of opioid use.


Using this data, monitored areas with high opioid use and deployed emergency response resources and abuse prevention interventions to hotspots accordingly.


Utilized similar wastewater testing data and tracking methods to monitor COVID-19 levels and identify outbreaks.

The Desert City’s Approach to Data

Like so many other cities in the country, Tempe, Arizona has been deeply affected by the opioid abuse crisis. The desert city of nearly 200,000 is part of Maricopa County, Arizona’s most populous area. This county also has the highest number of opioid-related deaths in the state.

As this public health emergency became more devastating in Tempe and around the country, Tempe’s leaders realized they needed to step up in two ways. First, they needed to be transparent about the severity of the problem facing the community. Second, they needed to create innovative solutions to help stem the opioid epidemic.

In 2018, the Strategic Management and Diversity Office, in partnership with ASU’s Biodesign Institute, submitted a proposal to the Tempe City Council Innovation Fund. The proposal focused on using wastewater to track the presence of opioid metabolites at the community level. City leaders supported the idea with innovation funds and began a partnership with ASU to tap this unlikely resource for data and to better inform decisions. Today, Tempe is on the cutting-edge of opioid abuse prevention work in the United States and has expanded this partnership to gather data on the presence of COVID-19 in the community.

“Cities may not want to call attention to opioid overdoses or abuse in their community,” said Wydale Holmes, a strategic management analyst in the city’s Strategic Management & Diversity Office.

“In Tempe, we’re courageously saying, ‘Yes, we have that, but we’re also doing something about it.’

It turns out that sewage offers an abundance of public health-related data — including a community’s drug consumption patterns. Tempe leverages its wastewater to identify areas of the city with elevated levels of opioid compounds — and then deploys emergency response resources and abuse prevention interventions to hotspots accordingly. All of this aligns to one of Tempe’s performance measures: ending opioid-related abuse and misuse by 2025, as measured by the percentage of 911 calls likely related to the drugs.

“Tempe is committed to data-informed community solutions. This first of its kind city model using wastewater-based epidemiology data informs strategic policy and operational decisions to advance community health.”

Director of the Strategic Management and Diversity Office Rosa Inchausti

It’s great to have data, but if you’re not doing anything with it or connecting it to resources and strategies for change, then it’s just information.”

Strategic Management Analyst Wydale Holmes

A New Diagnostic Matrix

Testing wastewater for real-time information about key markers of public health — everything from viruses to food contaminants to drug compounds — has been around for decades. But the approach is relatively uncommon in the United States. And no other city is trying to map the needs of residents around the opioid abuse epidemic in this way, said Dr. Rolf Halden, a professor at ASU’s Biodesign Center for Environmental Health Engineering.

“The United States is behind Europe. Every community that has done this work has not abandoned it, which is a testament to how well it works and how successful it is,” said Dr. Halden, who leads the wastewater data collection project in partnership with the City of Tempe.

Dr. Rolf Halden and his team analyzing the wastewater samples.
Image courtesy of the City of Tempe.

Here’s how the wastewater analytics project helps the city identify opioid abuse hotspots and deploy resources strategically. Dr. Halden’s team takes raw sewage samples directly from five collection areas of the city for seven consecutive days each month. The scientists then test for four different types of opioids: fentanyl, heroin, oxycodone, and codeine.

After processing the samples, the ASU team hands off data to Tempe’s Enterprise GIS and Analytics team. The city can see where elevated levels of the four opioids are, and whether the opioids were metabolized or improperly disposed of. But the data contain no personally identifiable information — there is no way to tie data to specific addresses, neighborhoods or businesses.

Created by William Mancini for Fighting Opioid Misuse by Monitoring Community Health and provided courtesy of the City of Tempe.

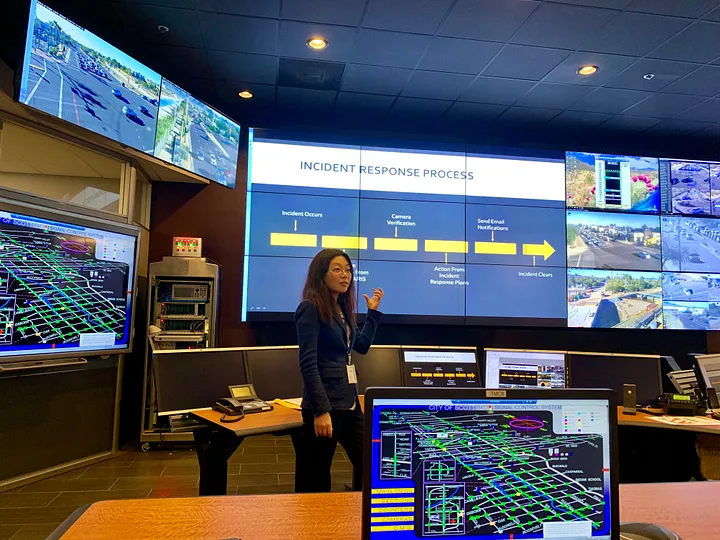
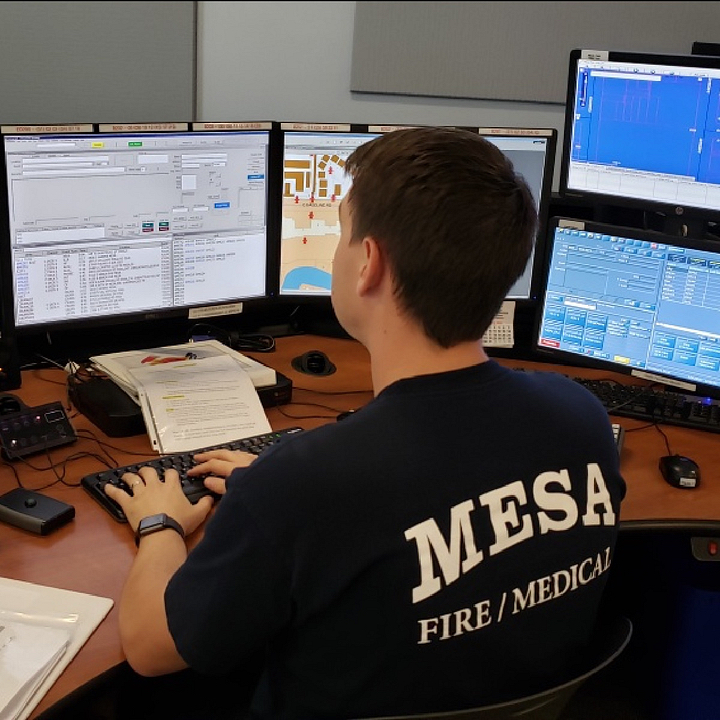
All data are then published on the public Tempe Opioid Wastewater Collection Dashboard, created and maintained by Dr. Stephanie Deitrick, Tempe’s Enterprise GIS Manager. Through this dashboard and the Opioid Abuse Probable EMS Calls Dashboard, the information is analyzed by a multidisciplinary team, including Tempe’s Fire Medical and Rescue Department, to determine needed interventions. For example, if the data show a rise in opioid use among people under 18 in one area, the city might ramp up in-school outreach efforts. If one area suddenly becomes a major hotspot, the Tempe Fire Medical and Rescue Department can decide which emergency medical services and overdose prevention resources to move or increase to that area.

After implementing interventions, city officials can then track their potential effectiveness by monitoring changes in wastewater data alongside the EMS calls data. It’s a data feedback loop enabling the city to target its efforts — and, hopefully, prevent abuse and deaths.

“Dashboards allow people to quickly see overall trends within the data and to understand who is being impacted and where. Providing context is key when providing data to inform decision-making.”

Enterprise GIS Manager Dr. Stephanie Deitrick

Building a Data-Driven Culture

From its outset, the wastewater analytics project was directly tied to Tempe’s performance measure of ending opioid-related abuse and misuse. The Mayor, City Council, and City Manager set the expectation that reducing calls for opioid misuse or abuse was important to the executive leadership, and that both the goal and the performance measures supporting it needed to be shared internally with the City Council and administrative staff, community partners and externally to residents.

“Whatever we do, we always approach our employees and explain it to them and take the time to have the conversations about what we’re doing and why,” Tempe City Manager Andrew Ching said. “Every job has a purpose, and that job and that purpose exist within the framework of our strategic priorities and performance measures.”

City leaders also worked to communicate their efforts around the opioid abuse epidemic to the general public. The City of Tempe held an Opioid Town Hall in February 2019 to detail the wastewater project partnership and the types of support that Tempe provides to its residents struggling with opioids, their families and caregivers.

Anyone can visit the wastewater data dashboard and the Opioid Abuse Probable EMS Call Dashboard, designed and conceptualized by Dr. Deitrick and her team. The latter dashboard, which launched in 2018, gives Tempe Fire Medical and Rescue Department and the public a window into opioid abuse in the community. It details when calls related to abuse occurred, along with patients’ ages and genders, and the number of times Narcan/Naloxone overdose reversal medication was used during opioid-abuse related emergency calls.

Together, both dashboards inform Tempe officials’ efforts to end opioid misuse and abuse in the city, and help first responders and public health agencies on the ground see the impact of the targeted outreach and other interventions. It’s too early to tell how quickly the city will advance toward its goal — it was officially set in December 2019, when the baseline percentage of opioid-related EMS calls was 3.74 — but the right approach to data is in place to drive progress.

As the COVID-19 pandemic took hold around the world and in Tempe, city leaders have once again partnered with ASU wastewater researchers and are using this data in the same manner as the opioid data. The city is following the data to find areas of greatest need and is directing resources to help.

Join Our Certified Cities!

Scottsdale, Arizona, USA

From the Pony Express to AI Traffic Control: Scottsdale Drives toward the Future with Data.

Project Type:
Communications, High-Performing Government, Infrastructure, Parks & Recreation, Technology, Transportation

2023 Gold Certification & 2024 Gold Certification

For several years the City of Scottsdale has been tracking and monitoring short-term rental properties and complaints about them. In 2022, the Arizona Legislature passed a law allowing cities to license short-term rentals and regulate nuisance properties. The City quickly sprang into action, adopting rules requiring short-term rentals to be licensed and creating Good Neighbor Guides to educate short-term rental property owners and their neighbors about the requirements. The CIty also created a Short-Term Rental Map Tool that allows residents to view the license status and understand the impact of short-term rentals in their neighborhoods. The Map Tool draws on the City’s Data Service Standard – one of the first cities in the United States to publish one – that guides the City in developing reliable and informative data services and products for its residents and businesses.

2019 Silver Certification


Launched an open data portal that provides performance data to collective benchmarking databases, which allows cities to help each other set more informed targets and put their own progress into perspective.


Used predictive analysis to calculate yearly projected water needs, which has allowed the City to continue a 20-plus-year streak of pumping less groundwater out of its aquifers than it puts back in.


Teamed up with the Behavioral Insights Team (BIT) to identify the effectiveness of messages on utility bills through randomized control trials that led to more customers choosing eco-friendly, cost-effective options such as signing up for paperless billing.


Analyzed the effects of altering traffic signals after prior accidents to develop data-based, location-specific plans for minimizing traffic jams after future accidents.

Honoring Scottsdale’s Memory

The skies were clear blue at noon as a crowd cheered the world’s oldest official Pony Express to the end of its 200-mile journey, outside the Museum of the West, in Old Town Scottsdale. This annual delivery of 20,000 pieces of first-class mail is among the special events and other attractions that bring about 9 million visitors and around $41 million in tax revenue to this Southwestern city each year. Old Town, the City’s downtown, still grows olive trees from its first days of settlement in the late 1800s, at the same time that it has become the spring home of the San Francisco Giants and begun to emerge as a center for high-tech businesses. It’s just one manifestation of how Scottsdale, the “West’s Most Western Town,” is a city that remembers its past while steadfastly preparing for the future.

The Hashknife Pony Express comes to the end of its 200-mile journey in Old Town Scottsdale.

Adopting a Business Mindset in City Hall

Scottsdale stands out for adopting a business mindset to run a well-managed government, embracing transparency so that residents receive the information they deserve, and embedding data in decision-making to ensure the best outcomes. And the efforts are paying off — in conserving water, serving vulnerable residents, minimizing traffic jams, and beyond.

Scottsdale joined What Works Cities in June 2016 and, soon after, codified an open data policy and launched an open data portal. Scottsdale has also deepened its citywide performance management. City Manager Jim Thompson says, “When we look at data and analytics, even though we assumed something was best, when we overlay old data with new or more specific data, we may find a new way to do things.” To continuously evaluate progress is to continuously improve.

The City is publicly reporting on that progress through a public-facing performance management portal, and provides performance data to collective benchmarking databases, an effort that allows cities to help each other set more informed targets and put their own progress into perspective by comparing themselves to other similar municipalities regionally and nationally. Scottsdale has gone on to earn a 2018 Certificate of Excellence in performance management, the highest distinction, from the International City/County Management Association.

If it’s a flaw in a process that’s causing shortcomings in performance, Scottsdale has a solution for that, too: a cross-departmental team that helps colleagues from across City Hall implement process improvements. A recent project involved modernizing the website for reserving facilities like picnic areas or volleyball courts from the Parks & Recreation Department. What was once a landing page with instructions to call a landline transformed into a full-service resource for determining availability and making a booking. Use of the website increased 200 percent in the first month following the redesign. Most importantly, residents are happier, and the ability to provide better customer service is boosting morale among department employees.

Making Every Drop Count

The Scottsdale Water Department Director Brian Biesemeyer was acting City Manager when Scottsdale’s open data work got underway, so it’s no surprise that he’s pointing his team to the numbers to make sure “every drop counts,” as he aptly puts it. As a desert city, Scottsdale understands the value of water to residents and the economy.

Scottsdale’s Central Arizona Project water treatment plant on its Water Campus.

Each year, by October 1, the department must submit its water order for the following year — meaning calculations for projected water needs are already underway 14 months out. In 2018, by using predictive analytics, there was a difference of fewer than 100 million gallons (or 0.4%) between planned and actual water use. An inaccurate prediction could have required tapping into underground aquifers — a crucial reserve in this arid city — or paying for water it didn’t use. An accurate water order not only saved money; it allowed the department to continue to recharge local aquifers. In doing so, the City continued a 20-plus-year streak of pumping less groundwater out of its aquifers than it puts back in. Scottsdale was the first city in Arizona to achieve this feat — known as safe yield — and has received the Sustainable Water Utility Management Award, from the Association of Metropolitan Water Agencies, the highest industry recognition for municipal water providers. Accurate data analysis and transparency help drive better planning practices that benefit Scottsdale residents now and over the long term.

Data analysis has also saved the department nearly half a million dollars each year by tracing the need for costly meter replacements in one part of the City to a pH imbalance, now corrected, originating from the water plant serving the affected area.

Gathering BITS of Insight

Scottsdale regularly communicates with residents on everything from issuing water bills to recruiting new employees. When Scottsdale joined What Works Cities, it expressed an interest in identifying which messages resonate best with local residents. Scottsdale city staff teamed up with the Behavioral Insights Team (BIT) to determine the answer by using randomized control trials to test the effectiveness of messaging and keep tweaking them accordingly. Pretty soon, they identified messages on utility bills that led to more customers donating $1 per month to local nonprofits, or signing up for paperless billing, a more eco-friendly, cost-effective option.

After ending technical assistance with BIT, the City created a team of internal consultants — the Behavioral Insights Team Scottsdale, or BITS — to carry the work forward by helping staff in departments across City Hall apply behavioral science to their projects. The department that’s engaged most with BITS has been Human Services; they’ve identified effective messaging to recruit more volunteers for programs focused on assisting vulnerable seniors, including Beat the Heat and Adopt-a-Senior.

Most recently, they’ve focused on Adopt-a-Family, a program that recruits volunteers to provide food and gifts for income-eligible families during the holiday season. Human Services Specialist Sue Oh recalls a 2018 volunteer who received a family’s wish list, which included a request for a boy’s polo, and wanted to find out what style the child wanted.

When Oh reached out on behalf of the volunteer, she learned that the child’s mother had passed away; his grandmother was now caring for him and his siblings. Oh related this to the volunteer, who began to cry and shared that her husband had recently passed away. She said, “I know this is what I’m supposed to do,” Oh recalls, and voiced her plans to volunteer again this holiday season.

By integrating testing into communications, Scottsdale is more effectively and efficiently engaging with its residents.

The Road Ahead

Scottsdale’s Traffic Management Center.

Sometimes the effects of using data are quietly unfolding behind the scenes of what most residents see on a daily basis. Take the City’s Traffic Management Center, where analyzing the effects of altering traffic signals after prior accidents has informed the development of data-based, location-specific plans for minimizing traffic jams after future accidents. Now staff are turning those human-gathered insights into algorithms that will eventually allow machine learning to respond with greater precision.

There’s a lesson here: Getting from point A to point B in the best way possible is a great goal for the road — and a useful metaphor for driving progress effectively — but it always involves planning ahead. As Assistant City Manager Brent Stockwell drives back to City Hall after our visit to the Traffic Management Center, he paraphrases how a former council member once put it: “See those trees planted there? They’re there because someone in the past was thinking about the future.”

Join Our Certified Cities!

Phoenix, Arizona, USA


Project Type:
Community Engagement, Communications, Cross-Sector, Environment, Equity, Finance, Infrastructure, Public Safety

2023 Platinum Certification


Phoenix instituted data governance across departments and continuous community engagement to inform key policies, including the City’s climate action plan, contributing to the average Phoenix resident using approximately 34% less water today than the average resident in 1990.

2020 Silver and 2021 Gold Certification


Continually using data-driven planning and decision-making to prepare increasing temperatures and population numbers.


Crafted a narrative using date to make the case for increased funding for water infrastructure improvements, getting ahead of more costly potential future water shortages down the road.


Used automatic vehicle location (AVL) technology in garbage trucks to collect detailed data tracking pickup routes and analyzed which ways to pick up trash more efficiently, while maintaining safety.


Created HeatReady, a program that identified the highest temperatures and the lowest amount of shade cover, tracked and enabled equitable distribution of investment to support vulnerable areas exposed to extreme heat.

Rapid Growth in Phoenix

You might call it a good problem to have. Every single day between 2010 and 2019, the Phoenix metro area grew by about 200 people. Phoenix has been among the country’s fastest-growing cities for years, according to U.S. Census Bureau data — and it’s expected to double in size by 2040, up from nearly 1.7 million people right now.

“Phoenix was born to grow. For decades, since the 1950s, we have stretched our boundaries and reimagined what a modern desert city can be. And today, we are growing vertically as well. Strategic use of data has been an incredibly valuable guide as we continue to invest in infrastructure, technology, and services that ensure an equitable future for all residents.”

Phoenix Mayor Kate Gallego

All this rapid growth puts pressure on essential services — things like water, public safety, and waste management. Ensuring they remain reliable and accessible to all Phoenix residents takes careful planning that aligns infrastructure and services to where growing numbers of people live, work, and play. This is not a new challenge for the desert city, where the average daily high temperature is 86 degrees Fahrenheit. Phoenix’s population began taking off in the 1950s, when air conditioning became commonplace.

The city’s population isn’t the only thing on the rise, however. Climate change is pushing average temperatures higher in the Sonoran Desert, making Phoenix one of the fastest-warming cities in America. But not all residents feel the same heat. The hottest neighborhoods in Phoenix tend to correlate with lower-incomes.

With a hotter and more crowded future on the near horizon, the City of Phoenix is preparing through data-driven planning and decision-making. You can see this in how it is securing the most precious desert resource: water.

Staving Off a Drought With Data

One of Phoenix’s primary sources of water, the Colorado River, is becoming less reliable. City officials know this because they constantly forecast water availability while tracking regional demand and seasonal weather patterns, along with long-term climate change. The data doesn’t look good.

“Water is the lifeblood of any city, especially the fifth largest city in the nation located in the middle of a desert,” says Phoenix City Manager Ed Zuercher. “We have never taken water for granted. Continuous strategic planning throughout the decades, with data at the forefront, has allowed us to effectively manage potential supply challenges and opportunities for growth.”

With trend lines clear, city officials leveraged data to sound the alarm. Kathryn Sorensen, the Director of Phoenix Water Services, stood in front of the Phoenix City Council presenting data integrating economics, hydrology, geography and other subjects. An image of a black swan swam across the slides to underscore the possibility of a “black swan event.” Phoenix taps could run dry if the drought continued and the city remained so reliant on the Colorado River.

The Colorado River, one of Phoenix’s primary sources of water.
Photo by Mark Capurso courtesy of the City of Phoenix.

Elected officials never enjoy raising the costs of essential services. What Phoenix shows is that when the decision-makers have access to data that tell a clear story, hard decisions are made a little easier.

“Part of what we had to do to get the Council to fund big water infrastructure improvements was tell a story about what you’re getting, and why it’s worth it,” Zuercher says. In fact, by acting when it did, the Council avoided a more painful rate jump down the road, when water shortages might be imminent. “Because we started early enough with the 6 percent increase, we don’t have to do an 18 percent increase later,” he adds.

Smarter Trash Collection

Along with water, Phoenix’s rapid growth has increased demand for another basic service: trash removal.

Every 2,000 new homes typically requires a city to expand waste management services with an additional truck and worker, generally speaking. But impressively, for the past 11 years, as an additional 40,000 homes appeared in Phoenix, the city’s Public Works Department has not added one additional garbage truck, waste management worker, or increased collection fees. How did it pull this off? By using data to improve efficiency.

Using automatic vehicle location (AVL) technology in each of its garbage trucks, the city was able to collect detailed data tracking pickup routes across three months in 2019. It then analyzed those routes in search of ways to pick up trash more efficiently, while maintaining safety. Could school zones be avoided while school is in session? Could collection days for residents be strategically changed? Could dangerous left-hand turns be minimized?

AVL was implemented by the department 10+ years ago to fulfill the need of the operations team for real-time data and actionable data. In the beginning, installation of any AVL monitoring device on trucks was done using a phased approach since the collection trucks could not be taken out of service all at the same time. Nowadays, the newer solid waste trucks delivered to the city are already equipped with AVL monitoring devices and technology, per the city’s specifications.

With the help of AVL technology, the department was able to implement “New Way, Same Day” in 2012, which streamlined collections through route-balancing. “New Way, Same Day” allowed the department to collect trash and recycling containers on the same day, resulting in cost savings of about $1 million annually.

The operations team, in collaboration with the information technology and data services teams, have continuously updated and upgraded Phoenix’s AVL technology.

After diving into the geographical and logistical details, the team emerged with new collection routes that balanced safety requirements with the city’s pickup needs. This hadn’t been done since 2009 — a full 10 years prior. With strong communications about the reasons for change to both residents and the waste management workers on the ground, the department successfully updated its collection routes and systems.

Through data and efficiency, despite rapid population growth, the Public Works Department was able to maintain its monthly residential fee for trash and various waste diversion services for 11 years.

Just recently, however, the Phoenix City Council approved a rate increase to the monthly residential fee. Along with the increasing cost of providing a service, China’s stricter recycling policies, announced in 2017, greatly impacted the U.S. recycling industry resulting in a decline in Phoenix’s recycling revenue. The decline in revenue hindered Phoenix’s ability to maintain the current level of trash and recycling service it provides. But through an extensive community engagement effort to educate residents, the City Council felt confident that an increase in solid waste rates was needed to keep up with the demands of a growing metropolis.

“After more than a decade, the recent residential solid waste rate increase allows our department to maintain the same level of trash and recycling services our residents expect,” said Moreno. “We will continue to rely on good data to streamline our processes and make good decisions in managing our resources.”

Everyone Deserves Some Shade

Phoenix is the hottest major city in the United States, and it’s getting hotter. But rising temperatures threaten some residents more than others — parts of Phoenix are less hot than others due to the presence of shade and certain pavement materials.

To understand climate change’s impact on the city from an equity perspective, the city created HeatReady, a program to identify, track and respond to the dangers of urban heat. The program was funded through the Mayors Challenge, a Bloomberg Philanthropies initiative to help U.S. city leaders develop innovative ideas that tackle today’s toughest problems.

The first step was to gather basic data on heat across Phoenix. To do this, the city partnered with Dr. David Hondula, a professor at Arizona State University, who installed heat monitor sensors in eight locations.

“The Bloomberg Mayors Challenge really set us on course to begin coordinating all efforts to address the growing threat of rising urban temperatures in Phoenix. Data continues to guide us in identifying the areas of our city with the highest temperatures and the lowest amount of shade cover, enabling an equitable distribution of investment to support those most vulnerable to extreme heat.”

Deputy City Manager Karen Peters

Building on its long-standing partnership with Arizona State University, the city collaborated with researchers at ASU’s Urban Climate Research Center to gather and synthesize meteorological data from all across the city and install new sensors. Among the key findings: on the hottest days of the year, surface temperatures varied by up to 13 degrees between different neighborhoods, depending on greenness, shade cover, and other factors. The hottest spots were often in low-income communities. Dr. Hondula and his collaborators are now collecting long-term data in some of the city’s hottest neighborhoods to help the city track its progress over time in reducing heat inequities.

“Our partnership with the city on urban heat is a point of pride for the urban climate research community at ASU. We share the city’s desire to identify and prioritize the hottest and most vulnerable neighborhoods for future cooling investments. The opportunity to work in real-world settings also gives us unparalleled access to learn more about how the urban climate system works and how it can be improved, knowledge that we will work to translate into solutions with city and community partners.”

Arizona State University Professor Dr. David Hondula

The city plans to continue working with its partners at Arizona State University to place sensors throughout the city, and leverage data by strategically improving the built environment. For example, it will create shade in places where residents are in greatest need of walkable routes to public transit, and has begun resurfacing roads in pilot areas with lighter-colored pavement that doesn’t retain as much heat. There is potential for new buildings to be oriented to create better airflow and more shade in high-need places. The city continues to partner with non-profit agencies to offer cooling stations with free bottles of water and heat-safety information, at locations chosen based on heat data and public transit ridership.

Phoenix’s flyer on the warning signs of heat exhaustion
Source: Phoenix Summer Heat Safety.

HeatReady has just begun — the city is currently seeking additional funding for the program and planning to implement a comprehensive shade and cooling plan built from gathered data. But the program already shows a valuable way forward for cities on the frontlines of climate change. The city and Arizona State University are in the final stage of the development of a HeatReady assessment to measure a city’s “heat readiness.” Phoenix will be the pilot city to complete the assessment this year.

Read more about Phoenix’s journey here.

Join Our Certified Cities!

Mesa, Arizona, USA


Project Type:
Community Engagement, Finance, High-Performing Government, Housing, Infrastructure, Public Safety

2023 Gold Certification


Mesa created a strategic dashboard to help park rangers on the front lines supporting unhoused residents. One of the first cities to join WWC in 2015, Mesa has seen an increase in unhoused residents gravitating toward public parks. As such, park rangers have increasingly become essential points of contact with these residents. One ranger spearheaded a collaboration between park rangers and the Housing department to better equip rangers with ways to support unhoused residents.Data has been a key component of the effort; notably, the City launched an internal homelessness dashboard customized for park rangers. It shows types of communication between rangers and unhoused individuals, which city parks have the highest homeless populations., how many contacts involved opioid/fentanyl use, and more. One example of this data-driven collaboration happened when Housing opened its Housing Choice Voucher Program waitlist. Mesa park rangers used information from the dashboard to better assist individuals applying for the voucher waitlist, specifically helping them apply in parks using park rangers’ vehicle computers.

2020 Silver Certification


Tested potential station locations against call locations, and identified the best property the city could buy to lower call response times.


Collected and analyzed emergency calls data to understand where and when the calls occurred to increase response time.


Used data to organize and upload budgetary requests ensuring smoother delivery at citywide meetings.


Launched HackivateMesa to collaborate with residents on data-driven solutions to community issues.

Mesa’s Approach to Public Safety

On the eighth floor, under City Hall’s historic copper roofline in downtown Mesa, AZ, a small team of data experts works in a room known as “the Attic.” Part of the Office of Management and Budget, the team leads the City of Mesa’s data analytics work, providing departments with ad hoc support around specific projects.

For years the data scientists’ work had flown under the radar in Mesa, a city of about half a million people that sits 20 miles east of Phoenix. That changed after the team partnered with the Mesa Fire & Medical Department in 2016 to help them maintain their international accreditation from the Center for Public Safety Excellence (CPSE). The CPSE increased the data requirements portion of the accreditation process. Chief Mary Cameli was not sure that they could pull the required data from their system, creating a possible block to their accreditation. At the same time, she had heard that some fire and medical units were stretched thin due to an overwhelming number of calls. That meant that both the response time and well-being of emergency personnel was stretching beyond national standards, creating public safety problems.

The data analytics team’s first step was to collect and analyze call and response time data to understand where and when calls to the department were occurring. The results uncovered by the team were sobering:

  • Over the previous 14 years, the number of daily medical calls had grown by approximately 90 percent, on average.
  • The city’s average response time to a call was seven minutes — beyond the national response time standard.
  • Some stations and response units had much higher call volumes and longer average response times than others.

With the support of the data team, the Fire & Medical department analyzed the existing resources against the demand for service. Over the years, stations and response units had been added as the city grew. But during that time, both the demand for service and the type of service changed based on numerous factors, like age of neighborhood and density of housing. Using the demand data, the department was able to realign their existing resources to better balance the call load on personnel.

One of Mesa’s radio dispatchers hard at work. Image courtesy of Mesa Fire Department via Twitter.

Due to the heavy weight on medical calls, Fire & Medical also implemented two Medical Response Units. These units were composed of the same personnel as the all-hazards units but did not work the traditional 24-hr shifts, allowing for more flexibility in the location placement and therefore assistance in reducing travel time. The results of the redeployment were seen quickly and presented to the City Council’s Public Safety Committee.

While the redeployment addressed some travel time issues, it couldn’t address the overall call response time issue. To solve that problem, the department would need to invest in a new fire station in northeast Mesa to rebalance unit locations in line with where calls were coming from. That would require approval from Mesa City Council — and additional funding.

The data analytics team stepped in to help Fire & Medical make the strongest possible case for both the need and the location. The team’s models tested potential station locations against call locations, and identified the best property the city could buy to lower call response times. When Strategic Planning and Analysis Program Manager Mark Castleton and Fire & Medical leaders proposed the new station to the City Council, solid data proved to be the decisive factor.

“Reviewing the data and process behind the decision allowed the City Council to focus on the relevant information and to quickly achieve a consensus.”

Strategic Planning and Analysis Program Manager Mark Castleton

The data team set up operational reporting that the department can review on a daily basis. In addition, city management has requested that the data team update the demand/response model annually as part of the budget process.

“We reached out to the data team to help us evaluate the current resources and the placement of future units to help with distribution of calls and to reduce response times.”

Chief Mary Cameli

Converts to the Cause

These data-driven results made Mesa Assistant City Manager John Pombier and other city officials a convert. Previously, Pompier, who oversees fire, police, emergency services, and human resources, had made decisions based on argument and rhetoric instead of data-backed evidence and results. If department directors gave Pombier a compelling reason why they needed more funding and/or resources, he would agree.

Since the City’s data analytics team proved its value to the Fire & Medical department, Pombier has changed his management approach, pushing department heads to gather data and then make decisions. Now, all budgetary requests must be backed up with data.

That shift builds on years of momentum in other parts of Mesa city government. With the support of City Manager Chris Brady and Mayor John Giles, Mesa was one of the first cities to join What Works Cities in 2015. It initially focused on refining and scaling MesaStat, the city’s performance management program, with the support of the Center for Government Excellence at Johns Hopkins University.

City Manager Chris Brady and the Mesa Transportation Department during a MesaStat meeting.

Today, all departments now participate in MesaStat. Momentum to build a culture of data-driven decision making has really picked up in recent years. In 2019, Mesa hired its first-ever Chief Data Officer, allowing it to expand the city’s data governance practices. Public-facing efforts have also ramped up. Last year, the City launched HackivateMesa to collaborate with residents on data-driven solutions to community issues.

Empowering Employees to Step Up

Mesa’s Performance Excellence (PEX) Training Program is a great window into how the City has built its data-centric culture. Its guiding concept is that if employees are empowered to make improvements with the right tools and knowledge, they will deliver results. The City launched the program back in 2015 with the goal of deploying performance management and data analytics tools across departments to enhance decision making and improve performance. Any Mesa city employee can take advantage of training — and to date, over 1,500 have done so, on topics ranging from critical thinking to performance analytics.

A PEX certification program offers staff more structured professional development, and importantly, recognizes individuals for acquiring new skills and investing in themselves and the city. The Certification in Performance Excellence recognizes individuals for their “exemplary knowledge and effective use of the tools of performance management and continuous improvement.” Fifty-one employees from more than 12 departments across the city have now completed the certification program. It culminates in a capstone project that tackles a real problem facing the city.

Alison Walker, a budget analyst in the Office of Management and Budget, partnered with the Department of Human Resources for her PEX capstone project addressing the inefficiencies of a physical timecard system. Non-exempt employees have to punch in and out of work every day, and supervisors have to spend significant time entering timecard information and correcting missed punches. Walker’s PEX project analysis found that in 2018 alone, supervisors had to make 111,483 additional punches to correct employee oversights, and that the time they spent doing this translated into over $230,000 in wages.

Walker notes that one of lessons learned from the project was that “it’s important to let the data tell the story whatever that may be. Sometimes the original story you thought you were going to tell gets changed based on what the data depicts. Originally, I was hoping to find a way to reduce the time it took to fix a punch. After analyzing the data, I realized it’s better to encourage the employee to record their own punches as reducing the amount of time wasn’t a possibility.”

She presented her findings to Pombier, and the City has moved forward with two solutions: a mobile device platform offering digital time cards and a Missed Punch Campaign to promote the importance of accurate time cards across all departments.

Forecasting Balancing Act

Mesa’s data-driven performance management ethos is also apparent in its approach to utility rates, which have an outsized importance in the city. Mesa is the largest city in the United States without a primary property tax. The consequence of this quirk? With no property tax revenue, the City must be innovative in how it generates revenue. Major funding for an array of core city services must come from places like the water and electricity bills all customers pay.

But this is tricky, because what customers owe is based on their household’s consumption level. And in terms of water, consumption is impacted by how much it rains each year, because rain affects outdoor water use for lawns and landscaping. So for the City to accurately forecast its annual budget, it must analyze data on rainfall and consumption patterns and population growth projections, and then set utility rates accordingly. That task falls to Brian Ritschel, Deputy Budget Director, his team in the Office of Management and Budget, and utility departments. “The City is able to more accurately forecast consumption and usage based on seasonality by leveraging statistical forecasting techniques,” says Ritschel. “It informs and improves the utility rate setting process that will directly affect residents.”

Data analytics has become core to the crucial utility rate-setting process. The goal of that process isn’t just to bring in the revenue the city requires for services each year. Ritschel’s team also works to protect customers from sudden rate jumps that would translate into steep bill hikes. Smart use of data analytics allows the City to create long-term forecasts on a 5–8 year horizon, ensuring residents are not shocked when they open their latest bill. Through data-driven forecasts, the City can gradually increase a rate (e.g., 2% or 3%) annually across multiple years, instead of a drastic increase (e.g., 7%) in one year. “As the City of Mesa continues to grow, it is vital that the City has a multi-year forecasting process to balance the City’s growth with utility rate adjustments,” notes Ritschel.

Signs of Mesa’s remarkable growth trajectory are visible from the Attic in the City Hall: A construction site for the new Arizona State University campus sits a few blocks away. Mesa had the fifth fastest-growing job market and the eighth fastest-growing population in the country, according to Bloomberg CityLab’s 2019 rankings.

“Data is the fuel that powers our city’s efficient and innovative services, and the City has spent the last five years strengthening its capacities to understand, leverage, and forecast data and evidence.”

Mesa Mayor John Giles

As Mesa looks towards the horizon, the city is ready to both welcome new opportunities and tackle the challenges that come with rapid growth.

Join Our Certified Cities!

Glendale, Arizona, USA

Using its Data Chops, Glendale Steps Up to Serve Residents During COVID-19 and Beyond.

Project Type:
Cross Sector, Health and Wellness, High-Performing Government, Technology

At a Glance


Implemented data-driven changes when transitioning its temporary emergency assistance program to electronic systems. This allowed the city to better support residents during the COVID-19 pandemic.


Analyzed call data in order to help prepare the program’s staff to handle incoming calls, shortening response times and increasing positive customer service feedback. The city tracked calling data in order to create a dedicated team designed to help residents.


Launched a centralized service request portal that streamlines customer service for the entire city and ensures a request is routed to the right resources.

Glendale’s Introduction to Data

The City of Glendale, Arizona, takes pride in being a place that offers something for everyone. Professional sports are definitely in the mix — the NFL’s Arizona Cardinals and NHL’s Arizona Coyotes make their home in the city, which is about nine miles northwest of downtown Phoenix. But there’s a vibrant civic and social fabric as well in this rapidly-growing, diverse city of about a quarter-million people, manifested in arts and culture, parks, and government services.

The City’s Community Action Program (CAP) has been part of this fabric for more than 20 years, providing targeted aid to residents experiencing a crisis. The program helps residents unable to pay their rent, mortgage, or utilities due to a temporary emergency such as job loss or unexpected medical expenses. “We address the immediate need, but also work with clients to identify potential interventions with community partners and wraparound services that can help prevent the crisis from occurring again,” says Director Jean Moreno of the Community Services Department (CSD), which contains CAP.

When COVID-19 hit, demand for assistance skyrocketed and CAP’s capacities were quickly strained. When the City closed its offices due to the pandemic, CAP’s manual workflows presented a challenge. “Our work had revolved around in-person appointments to collect eligibility documents and complete paperwork,” Moreno says.

Working with Business Intelligence and Analytics Officer Jenny Durda, who the City had hired in 2019 after its initial partnership with What Works Cities (WWC), Director Moreno and her team quickly implemented a wide range of data-driven changes to facilitate CSD’s transition to electronic systems and expand CAP’s ability to support residents during the pandemic. It’s an example of what’s now possible in Glendale due to the strong data culture and foundational practices the City has built up in recent years — Glendale has focused on open data, repurposing, and performance & analytics, and received technical assistance to implement results-driven contracting from Harvard Kennedy School’s Government Performance Lab, a WWC expert partner.

CSD staff meet with Jenny Durda (at left). Image courtesy of the City of Glendale.

“Suddenly we had to develop electronic processes to deliver urgently needed aid to residents, so we embraced change, letting data lead the way forward.”

Glendale Community Services Department Director Jean Moreno

Building the Case for Change

Prior to the pandemic, residents had to call CSD to make an appointment and then apply for assistance in person. If they were missing any necessary documentation, they had to make an additional appointment to come back. The application process could stretch for weeks. Durda worked with the program administrator and key staff to revamp CAP’s call center process, starting with an analysis of call data. They discovered that even prior to COVID-19, the program was not staffed appropriately to handle all incoming calls because a performance review had never been done that would have provided data showing a clear resource deficit. With this information in hand, they worked across departments to source and train customer service representatives who had capacity to handle CAP calls.

Durda and Moreno then looked at individual performance data. They discovered that their top performer, in terms of quickly and accurately processing cases, was a long-time temporary employee. Using this performance data, Moreno was able to make the business case for transitioning the employee to full-time regular status. She was also able to address immediate staffing needs for CAP by training three library employees and a court employee who otherwise would have been unable to work during the pandemic.

“Digging into the data showed us why and how we needed to grow our capacity to meet residents’ needs during the crisis and beyond. The staffing changes enabled us to create a dedicated team that can better handle active CAP case management.”

Glendale Community Services Department Director Jean Moreno
A CAP staff member helps a resident apply for CAP aid. Image courtesy of the City of Glendale.

Process improvements, such as retooling CAP’s workflow to separate intake work from casework, also delivered efficiencies. After Durda discovered CAP’s technology platform offered online application functionality, the entire process was digitized just six weeks after the city offices closed.

Within the first weekend of the CAP application portal going live, 70 new people applied for assistance without requiring an in-person visit. Prior to the pandemic, it would have taken CAP staff four days to complete 70 in-person eligibility appointments. With data showing that some residents may lack personal computers and at-home internet access, the City also installed computer kiosks in lobby areas that were publicly accessible to facilitate online applications, and offered preliminary intake by phone.

As residents’ needs were clearly heightened due to the COVID-19 pandemic, the City was able to meet demand by making staffing and process improvement changes that emerged from a data-driven culture years in the making. As a result, CAP disbursed about 9,500 payments to support utility and rent payments in only two quarters during the 2020–21 fiscal year, compared to about 2,000 the entire previous fiscal year. The program served more than twice as many households in the city during that fiscal year, pushing out around $10 million. That’s more than tenfold the average assistance provided to residents during the previous three fiscal years. Today, Glendale is one of a handful of jurisdictions in Arizona with an online rental and utility assistance application portal. The City is both sharing successes and gathering new ideas to support its data-driven governance efforts through the WWC regional network in Maricopa County.

“There’s no such thing as plagiarism in government. The collaboration between the different cities and the technical assistance we’ve received through What Works Cities has been instrumental in elevating our work.”

Glendale Community Services Department Director Jean Moreno

One City, One Portal

In Glendale, that work goes well beyond CSD. To improve service delivery and resident communications, and deliver on its commitment to be data-driven, last year the City launched a service request portal called GlendaleOne that streamlines customer service for the entire city. Residents can file requests for nonemergency services using the portal, which allows them to opt-in for real-time notifications via text, email, or automated phone calls as submissions are processed. The City paired the portal with a performance dashboard allowing residents to look up time estimates for fulfillment of each type of service request in an open dataset, and track the City’s overall performance.

The portal has dramatically improved how the City handles service requests. “Before GlendaleOne, people were tracking requests in spreadsheets, in emails, or even leaving sticky notes on desks for follow-up,” says Amy Handlong, executive assistant to Glendale’s city manager. “Now staff and residents can submit a request in GlendaleOne and it automatically routes to the right people.”

GlendaleOne has captured 27,700 resident issues since its launch, compared to about 16,000 total that the old system captured across 21 years of use. Resident response has been very positive, according to surveys conducted by the City Council. Next up for Glendale? Quarterly performance management meetings across all departments to help automate processes, improve the quality of metrics, and show the value creation of programs, says Khala Stanfield, director of the Organizational Performance Department. The mission of the department, founded with strong support from the City Council in 2019, is to lead the City’s data governance and open data efforts across departments, among other things.

“We’re supporting growing momentum in Glendale to place data and performance metrics at the center of things,” Stanfield says. “Staff have seen the impact of new approaches, in terms of level of services and building trust with the community. The pandemic has urged the need for change. We must continue to look for new processes and efficiencies going forward.”

Join Our Certified Cities!

Gilbert, Arizona, USA

Innovating On the Fly: Gilbert Embraces Change During COVID-19.

Project Type:
Community Engagement, Communications, Environment, Equity, Finance, High-Performing Government, Infrastructure

WWC - Gold Certification Badge for year 2021

At a Glance


The open data portal increased community engagement by sharing up-to-date information on safety measures during COVID-19, growth and development for small businesses, transportation options, and conducting surveys about parks and recreation services.


Engaged the community to ensure that they stayed informed and up to date on community needs by utilizing the data received through surveys to drive decision-making for current and new programs.


Launched a business recovery program using feedback received from residents to support businesses through the COVID-19 pandemic. The program offered recovery grants, low-interest loans, and technical assistance programs to help both employers and potential employees.

How Open Data Helps Build Connections

aWhen the mayor of Gilbert, Arizona decided to hop into a DeLorean and belt out tunes “Carpool Karaoke”-style in a “Back to the Future”-themed YouTube video early last year, it was for more than just laughs. Gilbert officials were trying to get residents comfortable with receiving communications through the City’s social media channels.

In Gilbert, a sun-drenched city of more than 250,000 residents whose average age is 33, innovation, stakeholder engagement, and data-driven solutions have become top priorities. The pandemic underscored why. Whether helping small businesses survive or staff adjust to a new work-from-home normal, the City was able to quickly move into action. Its ability to do so in part stemmed from a strong data foundation built in recent years across Gilbert, located in the same “Valley of the Sun” as Phoenix. The City’s open data culture and infrastructure, as well as data governance and stakeholder engagement practices, were all in place prior to COVID-19. When the crisis hit, staff knew what data they had—as well as what quantitative and qualitative data they needed—to make effective decisions.

Its approach to distributing more than $9 million in hardship grants to local businesses struggling to survive the pandemic is a case in point. The City’s first step was to survey business owners to identify urgent needs and determine aid program priorities. With so many people shopping from home, business owners asked for funds to launch things like digital ordering systems and to obtain social media training.

Local business Bergies Coffee Roast House received a COVID-19 hardship grant from the City. Image courtesy of the City of Gilbert.

“We used surveys to guide what kind of help would be best,” says Jennifer Graves, Gilbert’s deputy director of economic development. The responses ended up helping over 450 businesses in Gilbert receive grants allocated from federal CARES Act funds. Any member of the public could find out how those dollars were being spent; Gilbert demonstrated its commitment to transparency by launching a dashboard that tracked funding allocations to local businesses, nonprofits, and other categories.

Moreover, staff were able to leverage their open data training to quickly expand Gilbert’s robust Open Data Portal resources in ways that helped local businesses weather the crisis. In April 2020, just weeks after the COVID-19 lockdown began, Gilbert’s Office of Digital Government launched Help Gilbert. The crowdsourced portal allowed businesses to share information about their COVID-19 procedures and amended hours and services with residents via an interactive map showing what stores were open and how to support them. Nonprofits also began using the tool to recruit volunteers, and residents also contributed information to help each other find essential goods.

Screenshot of the Help Gilbert portal. Image courtesy of the City of Gilbert.

Launched as a feature of the City’s 311 app, the portal was in part successful because of many residents’ knowledge of the app, which involved crowdsourced local info and an interactive map. To build interest in the new mobile app in 2017, the City had engaged residents by creating a holiday lights map and inviting people to share photos showcasing their decorated homes. That encouraged downloads and familiarity with the tool, so there was less education needed when the pandemic hit and Help Gilbert quickly launched.

“That’s our strategy with communication-related tools: Engage people in fun ways so they learn something. When the important stuff comes up, they already have the knowledge and familiarity.”

Gilbert Data & Technology Analyst Derek Konofalski

Brave New WFH World

Like so many local businesses, Gilbert’s government had to transform operations during the lockdown. The City’s staff of about 1,600 had to learn how to work from home, for starters. Weeks after that shift occurred, Gilbert’s Office of Digital Government began evaluating how the new normal was going with the goal of helping employees adapt. In late April, it launched a survey to determine people’s frustration and needs across all departments. As with its approach to distributing hardship grants, the City took a data-first approach, gathering information from stakeholders to guide decisions.

One big pain point for many teams: People missed their office printers—they could no longer just print out public-facing materials, like fliers and catalogs. Berchman saw an opportunity to help departments make a lasting pivot to digital. Her team launched “innovation hours,” a drop-in virtual gathering where staff could come and discuss their struggles and triumphs as newly minted remote workers. Those sessions helped teams that didn’t do much printing to share their experiences, giving staff who had been hesitant to stop printing a chance to see another way.

Screenshot from an “innovation hour” attended by members of Gilbert’s Fire and Rescue Department. Image courtesy of the City of Gilbert.

Most notably, the Parks and Recreation office moved its catalog to a digital-first format. The shift ended up delighting staff, who could easily update classes and cancel events with the touch of a button. More importantly, it provided the City’s many young digital-savvy residents with content in a format they clearly prefer, Berchman says. It was time for city services to evolve.

The digital government team took another survey of staff last fall, drawing on results to determine whether and how staff should return to the office. Some, including the digital government team, may remain fully remote or work partly remote and partly in-person.

The key to success in all of Gilbert’s change efforts—whether involving technology, open data practices, or stakeholder engagement—has been the openness of leaders and department staff to experimentation and change. When the pandemic hit, this data-oriented culture was ready to meet the moment with the help of a data storyteller, a data content strategist, and a digital engagement coordinator on the team. In the coming years, as Gilbert embarks on a data-driven strategic planning process to prepare for its next 100 years, that culture will likely deepen.

“It’s been amazing to watch the City build its data foundation and normalize stakeholder- and data-driven decision-making in recent years,” says Berchman, who helped create the Office of Digital Government more than nine years ago.

“All of that work helped us get through the pandemic—and will surely help us respond to future challenges.”

Gilbert Chief Digital Officer Dana Berchman

“We wanted to gather data from people who were in the trenches. We wanted to ask people what they really thought before making an assumption.”

Gilbert Chief Digital Officer Dana Berchman

Join Our Certified Cities!

Disclaimer