
Carlsbad, California, USA

Data and a Cross-Sector Approach Lead to Street Safety in Carlsbad.

Project Type:
Community Engagement, Finance, Health and Wellbeing, Infrastructure, Public Safety, Transportation

2024 Gold Certification


Carlsbad, California, achieved a 73 percent decrease in homelessness among veterans by leveraging data in new ways. A key to success was maintaining real-time personalized data on veterans experiencing homelessness, and using that information to catalyze collaboration among service providers to get veterans into permanent housing. The City also adopted its first “data service standard” aimed at making sure that new data products are designed to be as useful as possible for city leaders, residents, and others who may benefit.

2023 Silver Certification


Using road collision heatmaps and other data to inform interventions, the City saw a 19% decrease in all injury collisions.


Monitored progress and changed course when needed to achieve traffic goals using Performance & Analytics strategies.


City’s staff telecommuting policy reduced employee commute time by 47,000 hours and saved the City between $300,000 – $400,000. It has also improved traffic conditions for all city residents and eliminated 424 metric tons of greenhouse gas emissions.


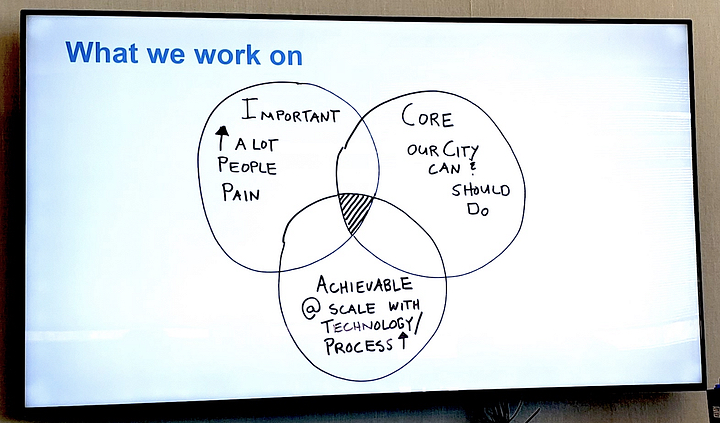
Budget and finance processes require data and alignment with the city’s 5-Year Strategic Plan, to ensure funds are efficiently and effectively allocated to address the most important priorities of the community.

The number of collisions involving bikes and e-bikes was already surging in Carlsbad when, in August 2022, two bikers were killed during a 10-day period. The City had issued an ordinance on e-bike safety a few months before, but the tragedies and an alarming 233% increase in collisions involving bike and e-bikes between 2019 and 2022 promoted greater action. City Manager Scott Chadwick declared a 6-month local emergency, which was ratified by the City Council at its next meeting. The emergency allowed the City flexibility to move quickly and focus resources on encouraging everyone to be safer on the road.

Some residents worried that the emergency declaration would lead to less access for bikes or more traffic. But Chadwick was able to reassure them. “We’re going to let the data guide us,” he said. And that is exactly what they did.

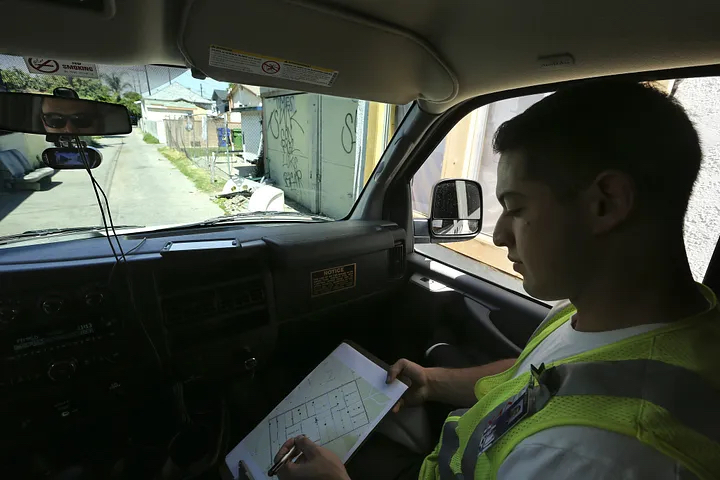
Immediately after declaring the emergency, the City began gathering and analyzing additional data on collisions. They created heatmaps to identify the most dangerous intersections, did a 5-year trend analysis, and set up tracking for the future. Armed with data and streamlined procurement processes as part of the emergency declaration, the City was painting key intersections and bike lanes with high-visibility green paint within two weeks. In fact, they moved so fast that they exhausted the supply of green paint in the region.

Within 30 days of the emergency declaration, the City had a full plan in place for improving street safety. The Safer Streets Together Plan seeks to change public behaviors and attitudes by focusing on education, engineering and enforcement. “It wasn’t just, ‘Here’s an emergency.’ The public saw real things happening in the first weeks and months and that’s how this has changed things so quickly,” Chief Innovation Officer David Graham said.

Six months after declaring an emergency, injury collisions across all transportation modes were down by 19% compared to the same time period in the previous year, and injury collisions related to bikes and e-bikes had decreased 13%. Graham points to qualitative measures of success as well – street safety yard signs and car window clings on display throughout the community, residents saying they are wearing helmets and slowing down, and the city’s partnerships with schools and bike organizations.

Because of the positive trends and evidence of behavior change, in March 2023 the City Council voted to extend the emergency declaration for a few more months. City staff hope that a year’s worth of data and analysis will help build a sustainable approach to traffic safety and that the early positive trends will become permanent.

The traffic safety emergency is not the first emergency that Carlsbad has tackled with data-driven decision making. It took a similar and equally successful approach during COVID. Hopefully the City won’t have cause for testing its emergency response again anytime soon, but having a well-honed system for collecting and analyzing data, and for innovating and tracking outcomes means that no matter what the future holds, Carlsbad will be well prepared to handle it.

“To see transformation in government you have to invest in areas that aren’t readily apparent like data and analytics, process improvement and operational excellence. When we work together with our community to discover shared insights around issues like traffic safety, we can create impactful change.”

David Graham, Chief Innovation Officer

It’s not easy to change the way people behave on the road. Often, you’re trying to change habits people have had for years or decades, for better or worse. By taking a balanced approach to traffic safety and digging into the data, we can see what’s working and what isn’t working, and learn how to be more effective as we move forward.

Scott Chadwick, City Manager

Join Our Certified Cities!

San José, California, USA

Project Type:
Community Engagement, Cross-Sector, Equity, Health & Wellness, High-Performing Government, Infrastructure, Technology

2023 Gold Certification


San José is maximizing AI opportunities and minimizing risk with its new AI practices and framework. When San José originally achieved Certification in 2020, the City was closing the digital divide and building out a citywide digital infrastructure. Today, they’re still technology pioneers with their new AI Review Framework. The framework lays out the process for departments to request AI tools and assess benefits and risks when considering these AI tools. San José also launched a public Algorithm Register to share the purpose and impact of the City’s current AI systems. Additionally San José joined an AI coalition with 100 U.S. government agencies to best navigate the benefits and risks of AI. San José’s AI approach is an example of how to reap the rewards of AI, mitigate risk, and boost trust and transparency with residents.

“Since taking office last year, we’ve strived to make City Hall more data-driven and accountable for results through the implementation of dashboards across many departments. San José is officially one of the most data-driven, well-managed local governments across the country and we’re working tirelessly to create the safe, clean, housed city we all deserve.”

Mayor Matt Mahan

2020 Silver Certification


Implemented public-private partnerships to identify barriers to break down the digital divide and make internet access more equitable in one of the nation’s largest cross-sector digital inclusion efforts to date.


Set up grant-based contracts for local community-based organizations to help them deliver broadband to 50,000 unconnected households by the year 2030.


Launched an app for residents to both submit service requests and receive service information from the city, which fields 165,000 service requests a year.

The Silicon Valley

San José ’s status as the capital of booming Silicon Valley is hard to miss. Construction cranes dot the skyline, powering the City’s steady downtown growth. Major tech companies like Zoom and Cisco call the city home, Google will soon open a huge new campus on 60 acres downtown, and giants like Apple and Facebook are headquartered in suburbs just to the west. With great pride in its diverse heritage, this is a city oriented toward the future, a stance reflected in San José City Hall. The postmodern structure’s glass-paneled rotunda confidently embraces the Valley’s nearly constant sunshine.

With five major roadways criss-crossing the city, a gleaming new BART line, and a major public transportation hub set to open in 2021, strengthening connections to Oakland and other East Bay locales, San José is poised to become a true hub of the Bay Area. The region’s tech talent and entrepreneurial spirit is alive in City Hall, with leaders and staff of all stripes having spent time in the local private sector. They bring big aspirations of impact to this diverse city of more than one million people, of whom 40 percent were born outside of the United States, and over 10 percent live under the federal poverty line.

Underlying San José’s aspirations is a foundational belief in balancing innovation with equity and inclusion. It’s a new take on the Silicon Valley-esque mindset of growth at all costs. And it’s at the core of its “Smart City Vision” to deploy data-driven decision making and technology to continuously improve how City Hall serves residents.

Using Data to Bridge the Digital Divide

Universal broadband access is part of the city’s current “Smart City Roadmap.” The fact that people in Silicon Valley’s largest city lack broadband access was unacceptable to city leaders, so in 2016, working from the premise that internet access is a basic human right in the 21st century, former Mayor Liccardo launched the Digital Inclusion Fund, pledging to close the digital divide.

Led by the Mayor’s Office of Technology and Innovation and the City’s Office of Civic Innovation and Digital Strategy, this public-private partnership between local government teams and external partners is believed to be the nation’s largest cross-sector digital inclusion effort to date.

The first step was to learn who lacked access. Working with external partners such as Stanford University, the City’s digital inclusion team used a variety of data sources to identify over 95,000 San José households without access to broadband. After creating a heat map of the digital divide down to the neighborhood level, the team canvassed over 600 residents and conducted street surveys and interviews in multiple languages to identify primary barriers to access.

Digital exclusion heat maps developed by the city to identify “digital deserts” and further identify which populations have the least access to a broadband connection. Image courtesy of the City of San José.

“We knew we needed to bring ‘hyper local’ solutions to San José’s digitally underserved communities. We integrated several data sets to develop a geography-based ‘Digital Exclusion HeatMap’ that allows the City and our partners to know exactly where to expand existing programs and develop new solutions — which library, community center, or park, for example, would be most effective in providing free Wi-Fi, device lending, and digital literacy training to our underserved communities in East San José.”

Dolan Beckel, Chief of Staff for the City Manager (former Director of the Office of Civic Innovation and Digital Strategy)

With this essential data in hand, the team identified three critical components for digital inclusion: (1) an affordable broadband connection at home, (2) a working device, and (3) digital literacy skills. The City then made the case to external private-sector funders, including major telecom companies and others in the private sector, to help fund the initiative.

A streetlight in San José outfitted with small cell technology. As of June 25, 2020, over 250 small cell sites were on-air and operating, with another 1,479 sites under construction. Image courtesy of the City of San José.

Funding for San José’s broadband strategy is bolstered by the deployment of “small cell” technology — basically, 5G-compatible antennae that can be installed on rooftops, streetlights, and other locations. Beckel’s team negotiated innovative outcomes-driven contracts with telecom companies Verizon, AT&T, and Mobilitie on behalf of Sprint: pricing was structured so that the cost per broadband-enabling small cell site built by the telecom giant was tied to the number of sites built. To support residents in need of the other two components of true digital inclusion — working devices and digital literacy — the team set up grant-based contracts with the California Emerging Technology Fund (CETF) and local community-based organizations.

The City is now on its way to improving broadband for all San José residents while simultaneously delivering broadband to 50,000 unconnected households by the year 2030. Since the implementation of the digital inclusion program began, 23 grants totaling $1,000,000 have been issued to San José community-based organizations with the goal of achieving 4,000 “adoptions” in the next year (i.e., connecting previously unconnected households to broadband internet access, ensuring household members have the appropriate devices, and providing digital literacy training). Average connectivity speeds across the city have improved fivefold to 30Mbps per second, and permits approved for construction of small cell sites have skyrocketed — up from five permits total in 2017 to more than 70 permits each week as of early 2020.

The vital importance of closing the digital divide and building out a city-wide digital infrastructure that connects all its residents — and ensures equity in digital access — was underscored by the COVID-19 pandemic. San José was one of the first places in the country under a stay-at-home order, which immediately presented challenges for work and education for the thousands of school-aged children in the city.

San José’s #SiliconValleyStrong landing page, which was designed specifically for the broader community in Santa Clara County to give and get assistance during the COVID-19 pandemic.

In addition to its ongoing digital divide work, to respond to the immediate needs at hand, the City quickly partnered with on-demand tech companies like DoorDash to support meal delivery to vulnerable residents. San José also steered critical regional leadership by launching Silicon Valley Strong, a multi-city initiative where residents can give help or get help with COVID-19 related issues. To date, more than 3,000 volunteers have signed up through the online platform, millions of free meals have been distributed throughout the metro area, more than 200 internet-enabled devices have been collected and distributed, and $27 million in donations have been raised.

Fighting Blight While Boosting Resident Engagement: There’s an App for That

San José’s city government has also improved its own digital infrastructure in recent years. In 2019, it launched My San José, a dashboard residents can access either through a mobile app or web browser to both submit service requests and receive service information from the city. Since My San José’s launch, the City has fielded 165,000 service requests a year.

The vision behind this tool, now called San José 311, is to “use data to make it easier for the community and local government to work together to keep San José safe, clean, and engaged,” according to Deputy City Manager Kip Harkness.

San José 311 landing page, where residents can live chat with a city customer service representative, request city services, and view various service data reports.

To that end, the dashboard focuses on five types of service requests: abandoned vehicles, graffiti, illegal dumping, potholes, and streetlight outages. Before, if residents wanted to request services related to these things, they would have to find the right phone number to reach the right call center, and rely on the call center to email the request to the right departments.

Now, residents submit their request through San Jose 311 and automatically receive information about expected turnaround time and the status of their request. Great customer service is built into the platform where residents receive confirmation that an issue has been resolved and an opportunity to provide feedback to the city. The City can now collect and analyze a robust set of data on specific service request areas and neighborhood needs, and strategically deploy staff and resources to boost efficiency and productivity. Real results have come from the new far more user-friendly system, including:

— Abandoned vehicles. The average initial response time for inoperable vehicle removal dropped from 15 days to four days over the last 12 months. Average time to complete a service request dropped to about nine days, from 27 days. A giant backlog of over 4,000 service requests was prioritized so that important requests were not left waiting, and has now been whittled down so that few high-priority requests remain untackled.

— Illegal dumping. Response times to cleanup requests used to take up to six months — they’ve dropped to less than a week thanks to work done over the past two years. With service requests far easier to make (they’d been handled over the phone historically), they have doubled within a year of the dashboard’s launch. The City staffed up, using service request data to justify an increased number of workers.

These kinds of improvements deliver tangible benefits to residents. Various studies have shown a high degree of correlation between neighborhood cleanliness and crime. The City is determined to use data-driven tools to remove early signs of blight — thereby preventing the need for more police services down the road. And there’s another benefit: Residents involved in service requests report being more engaged with the city, Harkness says.

“Responsiveness matters to those feelings of being heard and being engaged.”

Deputy City Manager Kip Harkness

Further progress is on the way, including language translation in Spanish and Vietnamese to increase community engagement, and piloting a chatbot to help reduce calls into the call center. Additionally, the City plans to add new services to the platform, starting with automating manual processes for recycling. The city is only “scratching the surface on the data we’re getting from San Jose 311,” Harkness adds.

Charting a ‘Smarter, Leaner’ Future

San José’s data-driven, iterative approach to innovation — which embraces “failing fast” to drive continuous improvement — is familiar to anyone who has spent time around tech startups. But the City’s mindset isn’t just a reflection of its Valley surroundings. It’s taken root out of necessity.

Through a long, slow recovery from the Great Recession of 2008, the City has had to use data to drive efficiency. Budget cuts reduced the city’s workforce by 16 percent from its pre-recession peak. Compared to similar-sized cities, San José has an extraordinarily lean staff: 6,700 employees for just over one million residents.

“We’re the leanest big city in the country,” former City Manager Dave Sykes says. “We cannot just throw resources at a problem to solve it. We need to be making decisions that are informed. We have to be smarter, leaner about how we do our work.”

“We have the capacity to use Silicon Valley’s genius to make this a valley of opportunity — that’s really important to us,” Beckel says. “We have a core of people who push hard to find different ways to do things better. This is a city and team laser-focused on addressing what matters to people in this city.”

“We are starting to measure what it is that the community wants and support the priorities of elected officials with data. The open data portal is the perfect place around which to coalesce those conversations.” says Chief Data Officer Joseph D’Angelo

A visual representation of the city’s approach to prioritizing work in service of working “leaner and smarter.” Image courtesy of What Works Cities, February 2020.

And, once an initiative gets underway, city officials look for evidence of success quickly. If something “fails fast,” that’s OK — it informs how the city uses resources going forward.

Join Our Certified Cities!

San Francisco, California, USA

San Francisco: Building Stronger Neighborhoods and a Data-Fluent City Hall.

Project Type:
Community Engagement, Communications, Environment, Health & Wellness, High-Performing Government

At a Glance


Since becoming one of the first local governments in the country to pass an open data policy in 2009, the City has continued to build on its commitment to transparency and putting data at the core of decision-making.


Surveyed 500 residents in five neighborhoods to determine and address the top concerns that have the greatest impact on the residents’ quality of life.


Implemented data skillbuilding courses for City staff resulting in each saving an average of 1.4 hours weekly — translating into $1.7 million in savings annually for the City.

San Francisco’s Fix-It Efforts

Residents of San Francisco’s Glen Park neighborhood gathered one evening with city staff outside the local BART train station in preparation for a Fix-It walk. The group would spend the next two hours walking around, noting problems such as street light outages or traffic congestion and developing a plan for repairs.

Judy, a Glen Park resident for 30 years, says she joined the Fix-It effort so that she could “get involved before the changes are implemented, rather than complaining about them after the fact.” That’s exactly what Fix-It Director Sandra Zuniga wants. “Doing fixes the community doesn’t want me to do is a waste of my time,” she explains.

Fix-It Director Sandra Zuniga speaks with a resident before a Fix-It walk in San Francisco’s Glen Park neighborhood.

The late Mayor Ed Lee launched the Fix-It initiative in May 2016 as part of his Safe and Clean Neighborhoods Promise to improve the quality of life in San Francisco. Making the city a better place to live and providing more efficient government services are part of his vision for San Francisco’s open data strategy as well. Since passing an open data policy in 2009 — becoming one of the first local governments in the country to do so — the City has continued to build on its commitment to transparency and putting data at the core of decision-making.

Fix-It is a great example of how data can ensure that cities are targeting the neediest communities. Initially, Fix-It was rolled out in five pilot neighborhoods where the City received a lot of complaints. Before Mayor Lee decided to expand the program into 20 more neighborhoods, the team surveyed some 500 residents in five languages in five neighborhoods to determine the top concerns that have the greatest impact on residents’ quality of life. The team then worked with the Mayor’s Office of Civic Innovation to map data from 311 and the San Francisco Police Department to visualize where those three concerns were most concentrated, leading to the identification of new target neighborhoods.

A handout distributed to attendees of the Glen Park Fix-It walk maps problem areas they identified during a community meeting held a few weeks prior.

In City Hall, Chief Data Officer Joy Bonaguro directs efforts to ensure that the broadest, best use of data is embedded in the City’s culture through DataSF, a team responsible for maintaining the City’s open data portal and supporting staff with data. DataSF offers a four-month engagement to departments that identify a challenge ripe for data science. Receiving the assistance is a two-way street, however, so each department must remain committed to a service change, if that’s where the data leads. The first cohort has been tackling issues that include keeping WIC-eligible women and their infants enrolled in a nutrition program and increasing eviction prevention.

Since 2014, Data Academy, a partnership between DataSF and the Controller’s Performance Unit, has grown from a handful of workshops on data visualization to nearly 20 courses on behavioral economics, information design, lean process mapping, and more. The goal, according to Bonaguro, is to “empower staff with the data skills that help them thrive.” In turn, they’re helping the City thrive as well. By March 2017, more than 1,700 city staff had attended training, and by taking what they’ve learned back to their teams, they are each saving an average of 1.4 hours weekly — translating into $1.7 million in savings annually for the City.

The City’s Performance Director, Peg Stevenson, notes that increasing staff capacity has prompted employees to help each other to problem-solve. There’s another ripple effect as well: policymakers are more frequently asking for data, and there are clear benefits for residents, too.

As the City continues to apply data to efforts promoting “real-time democracy on the ground,” as Bonaguro describes Fix-It, residents like Judy are showing up and demanding it.

She may just be starting to see the presence of Fix-It in her neighborhood, but Judy already seems to have a hunch that the effect of small fixes can really add up.

“It’s these little things that make your life good or bad,” she says.

Read more about San Francisco’s data journey here.

“Data helps people better understand what they should be expecting from the government.”

Deputy Chief of Staff of the Mayor Kate Howard

Join Our Certified Cities!

San Diego, California, USA

San Diego: Customizing its Own Portal and Building a Smart City.

Project Type:
Community Engagement, Environment, High-Performing Government, Infrastructure, Technology, Transportation

San Diego most recently achieved 2024 Silver What Works Cities Certification. The following narrative was written for San Diego’s 2020 Silver What Works Cities Certification. Some content may be outdated. For the most current information, please visit sandiego.gov.

At a Glance


Utilized an open source code to automate the publication of data sets to staff and residents in real time, saving time, resources, and reducing the potential for human error.


Created an app to allow residents to more efficiently report complaints and track progress by the response crews.


Relied on data to prioritize road repairs and how to time them with other infrastructure improvements, such as replacing water or sewer lines, to maximize efficiency.

Making Data Transparent

The City of San Diego has its own way of getting things done. While many of the cities leading the way in data-driven governance have been at this work for years, San Diego was a late bloomer. Most of the City’s open data efforts began in 2014, as Mayor Kevin Faulconer was taking office. Since then, Mayor Faulconer has created a Performance & Analytics Department, and the work has taken off. The City passed an open data policy and, soon after, hired Chief Data Officer Maksim Pecherskiy to begin implementing it.

After coming on board, Pecherskiy’s first order of business was to launch the City’s open data portal, and thanks to his background in programming, he brought a fresh perspective to the task. After reviewing several vendor options, he found that none allowed him to realize his vision. So, he set out to build his own, basing it on an open source project developed in Philadelphia. The portal, which only costs the City around $7 a month to host, launched with an initial 44 data sets voted on by the public for priority release.

Pecherskiy has also leaned on open source code to automate the publication of data sets to the portal. Most cities, he explains, have to publish data sets internally and then externally via distinct processes that can consume between 10 and 20 staff hours per month. But Pecherskiy has made it so that any public data sets automatically publish in both locations, saving time as well as reducing the potential for human error. Staff receive daily email digests with the most updated data, and residents gain access to new data sets nearly in real time. Pecherskiy says there’s also the potential to tie the automation to performance by triggering emails to management when data falls below a certain level.

San Diego also took an unconventional approach to starting its 311 program. The City has never had a designated call center for complaints, so residents often resorted to calling 911 or a non-emergency police number, but the latter was also answered by emergency operators. A resident satisfaction survey showed that 80% of San Diegans didn’t even want to make phone calls to report problems, so the City bypassed the traditional 311 model altogether and went straight to launching its Get It Done app. “We didn’t want to create a new call center that would likely become obsolete in the near future just because that’s how cities have always done it,” says Almis Udrys, Deputy Chief of Staff for Innovation & Policy.

After learning that 80% of San Diegans didn’t want to make phone calls to report problems, the City bypassed the traditional 311 model altogether and went straight to launching its Get It Done app.

Using Get It Done, residents can now report and track progress on a variety of complaints directly from their mobile phones, and response crews are closing the loop by sending “after” photos to residents, who can rate their experience with a thumbs up, thumbs down, or a comment. The app is helping the City become more efficient, too. Before the launch, paperwork for a resolved complaint might sit on a desk for weeks before being reflected in the data, meaning departments couldn’t track how quickly they were responding to issues. Get It Done data is also helping the City in other ways, such as identifying sanitation hazards while partnering with the County to address a recent outbreak of hepatitis A.

The City has applied its newfound data prowess to Mayor Faulconer’s doubled investment in road repairs and ambitious goal to fix 1,000 miles of road by 2020. “I think infrastructure is the ticking time bomb in most cities today,” says Udrys. “Our mayor is really getting out ahead of the problem.” By using data to prioritize repairs and time them with other infrastructure improvements, such as replacing water or sewer lines, the City is ahead of target, and residents can see the progress for themselves on the StreetsSDportal.

By using data to prioritize repairs and time them with other infrastructure improvements, the City is ahead of target on its goal to fix 1,000 miles of road in five years.

Across the City, the world’s largest Internet of Things platform is being rolled out through the installation of street lamps equipped with “smart” technology, part of a partnership with General Electric. Staff can monitor outages and adjust the brightness of the lights remotely, at the same time that sensors in the lamps are providing invaluable data. By monitoring pollution levels, the lamps can help the City better advance its Climate Action Plan, which calls for eliminating half of all greenhouse gas emissions in the City and aims for all electricity used in the city to be from renewable sources by 2035. The sensors will also help the City more effectively monitor parking spot usage, traffic patterns, pedestrian safety, and more.

Street lamps equipped with “smart” technology help the City gather invaluable data from pollution levels to pedestrian safety.

Deputy Chief Operating Officer David Graham recently recalled seeing a young couple and their children among attendees at a demonstration of the lamps. When he asked what inspired them to come, their answer was simple: they wanted their son to be safe if they allowed him to walk to school, and data would go a long way in helping them make the choice.

“We didn’t just want to dump data out there; we wanted to put it out there in formats that people could actually utilize. The data belongs to the people, so they should be able to access it.”

Councilman Mark Kersey

Join Our Certified Cities!

Salinas, California, USA

Salinas Data-Driven Youth Violence Prevention Strategy.

Project Type:
Community Engagement, Communications, Cross-Sector, Health and Wellness, Public Safety. Youth Development

WWC - Silver Certification Badge for year 2021

At a Glance


Implemented a strategic, data-driven plan that directed increased funding to a street outreach program that decreased the youth assault victim rate from 22% in 2007 to less than 10% in 2019. That success came from implementing a comprehensive approach to violence reduction.


Conducted a three-year data-driven effort that helped provide a clearer picture of how the city’s police department could better match calls for service with staffing and police officer beats.


Used online capacity assessments to help City staff concentrate outreach efforts efficiently and boost the effectiveness of external partnerships.

Making Safe Choices

In 2010, the Obama administration kicked off a pilot program to address violence in some of America’s toughest places. On the shortlist, alongside large urban centers like Chicago, Detroit, and Boston, was the midsize Central California city of Salinas.

The problems Salinas faced were not well known on the national stage, but residents were all too familiar with the gang violence plaguing their city. In just the first three months of the year prior, Salinas had seen a dozen homicides — and victims of violence were largely people under the age of 25. The inclusion of Salinas in the federal pilot highlighted both the severity of the problem and the potential to solve it.

“The others were bigger cities with bigger problems, but our crime rate was just as high,” says Jose Arreola, community safety administrator for the City of Salinas and director of the Community Alliance for Safety and Peace (CASP). Led by the City’s community safety division, CASP launched in 2008 to convene public and private stakeholders around the problem of youth violence. The program caught the eye of Justice Department officials who saw its potential.

As a result of the federal support, CASP was able to implement a strategic, data-driven plan that resulted in the rate of youth assault victims dropping from 22% in 2007 to less than 10% in 2019. That success came from implementing a comprehensive approach to violence reduction that involved increased funding to a street outreach program based on an assessment of gaps in current services provided by the City and nonprofits. The youth victim rate continued to drop in 2020, but increased slightly in 2021. Arreola attributes the increase to disruption of in-person services during the COVID-19 pandemic, which closed schools and paused street outreach efforts.

The successful violence prevention strategy is a major example of how Salinas’ commitment to foundational data-driven practices — especially performance & analytics and evaluations — has translated into meaningful results.

“The data has shown us that we’re moving in the right direction in terms of strategy and tactics.”

Community Safety Administrator Jose Arreola

‘Relationships Are Key’

What worked in Salinas is two-fold. Externally, CASP deploys a street outreach team that takes time to build trust and relationships with gang-affiliated youth. The aim is to reach individuals who are at risk before they become a victim of violence. Internally, the program convenes agencies and nonprofits and engages with them regularly, so that CASP staff can fast-track youth to the right types of services.

Four years ago, high school administrators identified the need to have on-site mental health services for students. Through CASP, the school district was able to connect with the City’s behavioral health department to place counselors at each school. They are still there today, a testament to the lasting effects of the program’s connections.

“The whole strategy of CASP is that relationships are key,” Arreola says.

CASP staff and partners at a 2016 meeting. Image courtesy of the City of Salinas.

His team relies on data to track the program’s progress. They work in partnership with the Monterey County Health Department to process data (from the police department and other agencies) and determine what is statistically significant. Homicide data, for example, is not useful in determining what drives violence, since it tends to be erratic. Heat maps that identify areas where violent assaults happen have been more helpful in guiding where the program directs its efforts, and in showing that it works. Arreola says his team is particularly proud of how the maps show hotspots diminishing over time.

“That represented thousands of youth not victimized by violence and thousands of families not living in fear,” he said.

CASP also uses data in the form of capacity assessments to gauge the engagement levels of existing partners, which helps City staff concentrate outreach efforts efficiently and boost the effectiveness of CASP’s external partners. Assessments have also helped identify new partners. For example, mindful that hospital-based violence intervention programs have proven to be valuable parts of other cities’ comprehensive strategies, the City launched a pilot out of the Natividad Medical Center’s Level II Trauma Center. The program, which offers trauma-informed care to violently injured patients, is now permanent.

Another reason CASP has been so effective is that it bridges a common gap among cities with gang violence: It’s not easy to connect young people who have dropped out of school with services. They often do not get any help until they make contact with the justice system after being arrested.

Having the data to show that CASP works helps sustain the effort. The initiative is now supported by a variety of funders including foundations and government grants.

“Funding for something like this can be a tough sell. Ideologically, a lot of people believe kids involved in this lifestyle are making a negative choice and don’t deserve help. That’s a hard narrative to push back against.”

Community Safety Administrator Jose Arreola

An Evolving Police Department

The progress Salinas has made in reducing gang and youth violence has coincided with a period of transformation within the City’s police department. One goal was to make the department’s officer corps look more like the people they interact with.

As the city’s population shifted from 47% Hispanic in 2016 to 73% Hispanic in 2021, the police department shifted its hiring practices to prioritize adding Spanish-speaking staff. Over that period, it has hired an additional 26 officers who are Hispanic, for a total of 73. The department also more than doubled the number of female officers over that period.

A Salinas police officer at work. Image courtesy of the City of Salinas.

“We can truly say that we are the community and the community is the police department,” Police Chief Roberto Filice says.

The department also embarked on an efficiency study in 2017, a three-year data-driven effort that helped provide a clearer picture of how it can better match calls for service with staffing and police officer beats. As a result, it may implement a new beat system for the first time in three decades to spread the workload more evenly across staff.

The department also piloted a fourth shift this year that helped align staffing with times of day when calls for service are more frequent. The fourth shift, which overlapped with existing morning and afternoon shifts, helped the department maintain its response time — four minutes and 28 seconds — even as it saw an increase in calls and operated with an overall reduced staff. In the last four years, 15 positions have been cut from the force due to budget reductions: the equivalent of an entire shift.

Chief Filice says he won’t be able to continue the fourth shift or make the beat changes immediately due to the staffing shortage, but he is confident that the numbers demonstrate the value in innovating and realigning the department to fit the community’s evolving needs.

“I am a data-driven person. I love using technology to make us more efficient.”

Salinas Police Chief Roberto Filice

Join Our Certified Cities!

Los Angeles, California, USA

Los Angeles: City of Angels Leads in Transforming Data into Action.

Project Type:
Community Engagement, Communications, Cross-Sector, Equity, Finance, High-Performing Government, Housing, Infrastructure

Los Angeles most recently achieved 2024 Gold What Works Cities Certification. The following narrative was written for Los Angeles’s 2020 What Works Cities Certification. Some content may be outdated. For the most current information, please visit lacity.gov.

At a Glance


Published key metrics of success on the Mayor’s Dashboard allowing residents to see how the City is performing.


CleanStat measures quarterly, block-by-block assessments of the entire city to build data on and identify trends in street cleanliness.


After examining an index combining data of displacement patterns with predictive analysis, LA launched a campaign to raise awareness for tenants’ rights, reaching over 20,000 residents in the first year.


Open Data portal provide residents easy access to mapped sets of open data related to health, safety, schools and more.

How LA Measures Success

Los Angeles City Hall has a room with a view. Visitors who make their way to the building’s public observation deck can enjoy a vast panorama of the city below, home to some 3.9 million people. Inside City Hall, the permeation of what works practices is vast; one gets the sense that, after his election, Mayor Eric Garcetti came to the observation deck, looked around, and set out to determine how to embed data in everything the City touches.

That’s why one of his first moves as Mayor was to ensure that all 36 of the City’s General Managers develop key metrics of success for their departments, and then began tracking the data that would monitor progress toward their goals. Their progress is published on the Mayor’s Dashboard, where residents can see for themselves how well the City is performing — setting a new precedent for transparency in municipal service provision.

“Data shines a light on the problem and inspires targeted action. It allows us to be more proactive, more efficient, and more engaging.”

Los Angeles Mayor Eric Garcetti

CleanStat

As part of his Back to Basics approach, Mayor Garcetti launched CleanStat in 2016, so that all communities, regardless of their economic status, could enjoy clean streets. CleanStat, the nation’s most comprehensive street-by-street cleanliness assessment system, provides quarterly, block-by-block assessments of the entire city to build data on and identify trends in street cleanliness.

A sanitation worker assigns a cleanliness score to an LA street, part of the City’s Clean Streets initiative. (Photo credit: Los Angeles Times)

“When I came into office, my priority was to improve the quality of life for all Angelenos, and the use of data in assessment, monitoring, and implementation helped us achieve that,” says Mayor Garcetti. “Using data allowed our street-cleaning efforts to shift away from a reactive approach, and instead, focus on a methodical and equitable way.”

With CleanStat, staff from the Bureau of Sanitation drive all of the more than 20,000 miles of the city’s public streets and alleys, assigning a cleanliness score from 1 to 3 — or from clean to not clean — to every block, once a quarter. Those scores are added to the Clean Streets Index, where department officials can keep track of performance and residents can hold the City accountable for its goal to eradicate red grids (ones with a score of 3) by 2018. Residents who want to get more directly involved can sign up for the Clean Streets LA Challenge, with the potential to secure funding for a project to make their neighborhood cleaner.

Before and after a Clean Streets cleanup.

Because workers are generating service requests as they conduct assessments, the new approach is helping the department become more targeted in its response. Now, resources can be deployed to meet the specific needs of the site, and response teams can maximize efficiency. The department is also addressing between 4,000 and 6,000 service requests each quarter that wouldn’t have been called in otherwise, meaning streets are being cleaned more quickly. The results speak for themselves — just one year after its launch, the City had already reduced the number of unclean streets by 82%.

Rent Stabilization Ordinance Campaign

As in so many cities across the country, ensuring adequate access to affordable housing is a growing challenge in Los Angeles. Nevertheless, tenants living in any of the nearly 624,000 units covered by the City’s Rent Stabilization Ordinance (RSO) have many rights that aim to keep them in their homes, including protection from excessive rent increases. But when the City’s Housing and Community Investment Department (HCIDLA) began to survey residents, staff made an alarming discovery: nearly one third of renters and nearly as many landlords were wrong about — or were not even aware of — their rights and responsibilities under the RSO.

Data helped LA identify which neighborhoods to target with a campaign to raise awareness of tenant rights under the City’s Rent Stabilization Ordinance.

Through Mayor Garcetti’s Innovation Team (i-team) within his Office of Budget and Innovation, the City of Los Angeles launched a multi-faceted Home for Renters campaign in 2016 to raise awareness of tenant rights through direct outreach, the creation and distribution of easy-to-understand educational guidebooks, placement of PSAs, and more. To ensure the campaign targeted the most vulnerable residents, the i-team examined an index combining data of displacement patterns with predictive analysis on where displacement was likely to occur, mainly households with incomes under $30,000 and areas with high concentrations of RSO housing units and complaints. In its first year, the campaign has reached over 20,000 people online, and more through rigorous field outreach, multilingual handbooks, and strategic ad placement on city buses and benches — all with the goal of increasing the awareness of rights and responsibilities for tenants and landlords under the RSO.

More City Data, More City Solutions

A culture of data use has led to other notable developments, including a new portal tracking all city-owned properties so that staff across departments can better maximize available real estate assets when looking to develop new public amenities. A recent call for a Chief Procurement Officer demonstrates the City’s commitment to modernize the City’s procurement process in response to new technological advancements and data-collection capabilities. Through its Data Science Federation, the City is partnering with local colleges and universities to accelerate its use of data-driven tools at the same time that it’s creating a pipeline to bring new talent into local government. And the City is using data to see what works and what doesn’t as it pilots potential solutions to such challenges as police hiring, problem intersections, and the urban heat island effect before scaling them.

The City’s focus on data also aims to increase civic engagement with residents. Los Angeles’ open data portal greets visitors with an invitation to “find the data useful for you,” while the City’s GeoHub empowers residents with quick access to mapped sets of open data related to health, safety, schools, and more. These efforts are as much about fostering transparency as they are about working to build relationships with residents centered on collaboration and problem-solving.

“When the City gives residents the information to discuss our challenges, we are opening the door for them to help us work towards the right solutions. Los Angeles is a city that leads, and we are proud to pave the way for greater inclusion, opportunity, and equity for our residents in an era of accessible data that’s also ripe for innovation.”

Los Angeles Mayor Eric Garcetti

Join Our Certified Cities!

Long Beach, California, USA

Data Takes Center Stage in Long Beach’s Pandemic Push to Help Small Businesses.

Project Type:
Community Engagement, Communications, Cross-Sector, Economic Development, High-Performing Government

WWC - Silver Certification Badge for year 2021

At a Glance


The BizCare team set up a data collection system to track who visited a BizCare site, applied for relief, and successfully received funds during the height of the pandemic. They fed data back into GIS maps in real-time, and regularly reviewed them to adapt how the City was meeting communities’ needs.


Working alongside other departments, the economic development team was able to adapt their practices to best support local businesses during the height of the pandemic.


Data dashboard supported COVID-19 response and recovery efforts by informing the community of updates and tracked vaccine distribution.

Community Outreach

COVID-19-related restrictions hit local businesses hard in Long Beach, California, as they did across the country. Along with uncertainty and confusion related to evolving public health orders, many business owners grappled with a simple existential question: How will my business survive?

The City of Long Beach’s Economic Development Department stepped up to help, launching a call center to help business owners navigate health orders and access financial resources such as grants and loans. But the department’s team quickly realized this approach didn’t go far enough. Demand for relief was very high, but staff knew from tracking callers that many business owners were not accessing available services.

With government buildings closed due to the pandemic, the need for better outreach methods to help businesses survive was clear and urgent. So the City pivoted to a more targeted data-driven approach. In November 2020, the department launched the Long Beach BizCare Program, which allowed City staff to more directly engage local businesses in high-need areas. BizCare created outdoor pop-up sites offering free one-on-one in-person services to small business owners, helping them complete business relief grant applications and learn about other available resources.

A group of “community ambassadors” who supported the City’s COVID-19 health outreach efforts attend a meeting. Image courtesy of the City of Long Beach.

This new strategy required close collaboration across departments so that pop-ups could be located in areas of high-need.

“The economic development team is small — the pandemic only heightened the importance of working with other departments. I served in the military, and the way staff came together to support the outreach effort felt like a military deployment. Everybody was moving at rapid speeds to assist business owners.”

Economic Development Project Manager Adelita Lopez

A first step was to understand which communities in Long Beach were most impacted by COVID-19 and least likely to have accessed relief resources. The City’s geographic information system (GIS) analysts worked with the BizCare team who provided layers of data detailing neighborhoods’ average income levels and engagement with City resources. To further prioritize outreach to high-need businesses, the BizCare team leveraged business license datasets to identify which businesses were open.

“Designing and rolling out the BizCare program was a crash course in how the right data is critical for designing a new service in a time of crisis,” says Ryan Kurtzman, Smart Cities Program Manager at the City of Long Beach.

“Residents are our eyes and ears on the streets, So if we’re looking for a mix of projects that will maximize benefit to the community, it makes sense to turn to people who are knowledgeable about what’s needed.”

Chief Data Officer Joseph D’Angelo

Building Trust, One Conversation at a Time

Many of the business owners visiting BizCare pop-ups had never previously interacted with the City of Long Beach or accessed government services. Building trust was a huge part of the outreach effort, especially since many grant applications require personal information such as Social Security numbers.

To build trust, the BizCare team chose to staff pop-up sites with people who lived in, or were originally from, priority outreach neighborhoods. It partnered with the City’s workforce innovation network Pacific Gateway to hire young people. With multilingual translation services available at each site, they helped business owners understand relief options and complete grant applications.

A BizCare street outreach team visits a local business. Image courtesy of the City of Long Beach.

The pop-up sites demonstrated the City’s commitment to careful stakeholder engagement. Staff in the Parks, Recreation and Marine Department as well as the Library Department helped BizCare identify safe spots for tents, with access to bathrooms and electrical outlets. With personal protective equipment (PPE) and laptops, mobile Wi-Fi hotspots, printers, and scanners borrowed from the City’s Technology and Innovation Department, BizCare staff helped business owners without their own computer or internet connection take significant steps toward protecting their business.

A basic goal of BizCare was to dynamically align pop-up locations to areas of high-need as the pandemic wore on. To that end, the team set up a data collection system to track who visited a BizCare site, applied for relief, and successfully received funds. They fed data back into GIS maps in real-time, and regularly reviewed them to adapt how the City was meeting communities’ needs.

As it happened, the BizCare team realized there were significant pockets of communities where businesses were not accessing available relief services. So it innovated again, developing a complementary street outreach team to go door-to-door in these areas. “Our goal was to offer business owners seamless support resources, between the call center, pop-ups, and the street team,” Lopez says.

One data point suggests the BizCare program succeeded in building trust in high-need areas. Eighty percent of pop-up attendees said they discovered BizCare through word of mouth. Maria Zepeda of Lili’s Store and Long Beach Snacks was one of the first business owners who worked with BizCare. It was her first time applying for any type of city aid. She received a commercial rental assistance grant of $4,000 and has since helped several other business owners on her block connect with BizCare.

The program’s targeted stakeholder engagement efforts have produced impressive results. As of December 2021, BizCare’s pop-ups supported 795 business owners, who have collectively received $760,750 in grant-based relief funds. The street outreach team engaged with 1,048 businesses, who have accessed over $100,000 in funds. The Call Center team answered 6,361 calls. The Community Based Organizations Partnerships team connected with 27 non-profit organizations to partner and reach some of the hardest-to-reach communities. Access to grant funding for business owners who don’t speak English increased more than 40%.

“Having team members with personal connections to the community was really helpful in building trust. For a lot of our staff, we were talking about their neighbor’s store or their uncle’s friend’s restaurant.”

Economic Development Project Manager Adelita Lopez

Strong Foundation Into the Crisis

BizCare’s success is a reflection of Long Beach’s investments in foundational open data and stakeholder engagement practices. Current data efforts kicked off in 2016 with the City’s launch of an open data portal and the development of a data governance structure to provide training and promote data-driven decision-making. During its creation in 2017, the City’s Economic Development Department developed a blueprint for inclusive economic growth informed by deep community engagement, including community listening sessions and interviews with community-based organizations.

One of Long Beach’s community ambassadors. Image courtesy of the City of Long Beach.

All this work laid the groundwork for BizCare, which launched within the context of a deepening data-driven culture of innovation.

“It’s been incredibly helpful that we have City staff invested in measuring what good governance looks like. The technical assistance we’ve received via What Works Cities as well as the Certification process itself have been really foundational for our COVID response and recovery efforts.”

Smart Cities Program Manager Ryan Kurtzman

Through the BizCare program, the City continues to engage with Long Beach business owners and use data to understand where support services might be the most impactful. Many of the data-driven outreach strategies honed by BizCare will be considered best practices for future COVID-19-related grant distribution programs, as well as deployment of Long Beach Recovery Act funds.

“I am proud of our efforts to use data to guide decision-making and improve community outcomes during the pandemic,” says Lea Eriksen, Long Beach’s director of technology and innovation/CIO.

“Cities need to design services with a digital equity lens to meet people where they are. Programs like BizCare showcase our commitment to building a data-informed culture, and that’s something we’ll be investing in for years to come.”

Director of Technology & Innovation/CIO Lea Eriksen

Join Our Certified Cities!

Disclaimer