New Orleans, Louisiana, USA

New Orleans: From “BlightState” to Preventing Fire Fatalities.

Project Type:
Economic Development, Education, Energy, High-Performing Government, Housing, Public Safety, Youth Development

WWC - Silver Certification Badge for year 2021

At a Glance


Created a data-driven performance management program and a website that aggregates data about important housing information to address blighted homes post-Hurricane Katrina, resulting in more than 15,000 fewer blighted addresses by 2018.


Worked with What Works Cities partner the Behavioral Insights Team to devise a “nudge” letter to owners about housing violations, resulting in a 10 percent drop in cases moving to the hearing stage, saving staff time and city funds.


Developed a predictive model that identified which parts of the city were most at risk for fires and fire fatalities using that information to target its campaign to distribute smoke alarms to vulnerable households.


Targeted anti-gang violence via prevention efforts and rehabilitation, which led to an 18 percent decrease in the number of murders as of 2016.

New Orleans’ Creation of New Orleans

One Thursday morning, some ten city officials seated in a u-formation of tables faced an audience of some two dozen local residents in a room at New Orleans City Hall. The city staff and residents all knew each other by first name, and they bantered a bit back and forth, which was no surprise as many have been regulars at this monthly meeting for years, regularly returning to follow progress and to fight for the removal of blighted properties that have proven more difficult to address in their neighborhoods.

BlightStat, a data-driven performance management program, has been in place since 2010. When Mayor Mitch Landrieu took office in May 2010, New Orleans faced what has been described as one of the worst blight problems in the U.S., “with no strategy to address it,” the City notes. A large part of the problem was the aftermath of Hurricane Katrina, which devastated the city in 2005. Five years later, faced with thousands of homes that could not be saved, Mayor Landrieu instituted BlightStat to ensure that the City’s efforts to get rid of the blighted homes would proceed efficiently and effectively.

BlightStat set priorities for the inspectors and researchers who identify rundown properties and determine whether to levy fines, order a demolition, force a sale, or take some other action. Under the BlightStat framework, the City considers issues such as the condition of the roof and foundation, the owner’s history of tax payment, and the market for real estate in that neighborhood, trying to predict the cases that will have the best outcomes so that the Department of Code Enforcement can decide how to best to deploy its resources.

New Orleans has 15,000 fewer blighted properties thanks to BlightStat, a data-driven performance management program that’s helped the City strategically address the issue.

The City also created BlightStatus, a website that aggregates data about inspections, code compliance, hearings, judgments, and foreclosures, providing users with a simple search box that unlocks all the information available for any address in the city. It opened up a new, easy-to-use link between the city and community, keeping everyone on the same page and giving residents the chance to make their voices heard. The tool also helped city employees keep up-to-date with changes to properties and stay accountable for promised changes.

By 2018, New Orleans had more than 15,000 fewer blighted addresses, accomplished through a mix of demolition, sale, and owner repairs, aiding vastly in New Orleans’ recovery.

New Orleans also worked with What Works Cities partner the Behavioral Insights Team to devise a “nudge” letter to owners about housing violations, resulting in a 10 percent drop in cases moving to the hearing stage, saving staff time and city funds.

New Orleans’ use of data undergirds many of its major programs. “We use data to plan. We use data to create an iterative process that informs implementation. Data is baked into our culture; it’s a part of our subconscious,” says Oliver Wise, former Director of the Office of Performance and Accountability (OPA), who was succeeded by Melissa Schigoda.

OPA runs the City’s data analytics initiatives. Along with BlightStat, they include ResultsNOLA, which evaluates the performance of city departments, and NOLAlytics, which helps those departments conduct their own data analytics projects to support their missions.

In one project, OPA developed a predictive model that identified which parts of the city were most at risk for fires and fire fatalities. The City used that information to target its campaign to distribute smoke alarms to vulnerable households. Using analytics, it identified twice as many households in need of smoke alarms than it had when the City chose households at random. Less than a year later, there was a fire in an apartment building in one of the neighborhoods that the City had identified, and eleven people escaped — all because of a very cheap, but strategically installed, smoke alarm.

To address its high murder rate, the City instituted its NOLA for Life initiative in 2012, targeting anti-gang violence via prevention efforts and rehabilitation, which led to an 18 percent decrease in the number of murders, as of 2016.

Mayor Landrieu, who left office in May 2018 after serving two terms, says he has always been data-driven, realizing that if you can’t measure something, you can’t assess outcomes. “Data shouldn’t make you look good — it’s intended to tell you the truth,” he says. “The results can speak for themselves.”
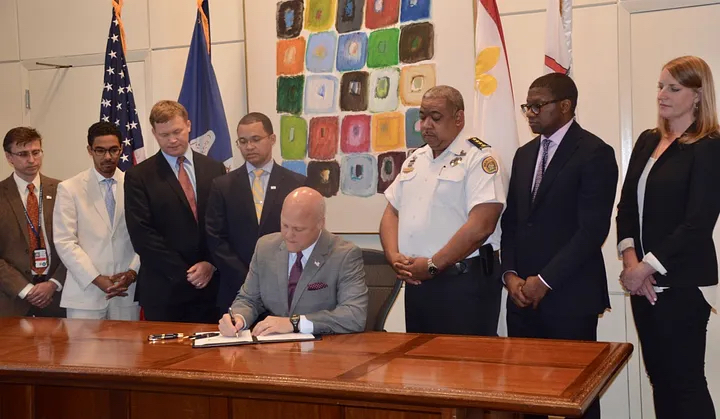
Mayor Mitch Landrieu signs the City’s open data policy, in 2016.

Landrieu says he told staff from the start that he “wanted to count everything” and to fold that sensibility into the budgeting process to run a “leaner, more efficient government.”

Landrieu says a “culture of counting” will have a real impact on the ground and make a difference in people’s lives. He created a Neighborhood Engagement Office to ensure managers are more connected to residents and see to it that “everybody’s data can matter.

As he looks back at his administration, Landrieu says he’s most proud of the team he assembled for their focus on getting things done in a data-driven fashion, and the processes they put into place to encourage innovation. “These processes were designed to last,” he says, “not to be a flash in the pan.”

“If you measure and it’s real, you gain the confidence of the public.”

New Orleans Mayor Mitch Landrieu
Join Our Certified Cities!

Baton Rouge, Louisiana, USA

In Baton Rouge, Data and Community Health Go Hand-in-Hand.

Project Type:
Communications, Equity, Health and Wellness, High-Performing Government, Infrastructure

2024 Gold Certification


Baton Rouge, Louisiana, used data to make several improvements to the way the City buys goods and services. For example, when a disparity study showed that women- and minority-owned businesses were getting only 4 percent of the City’s contract dollars, Mayor Sharon Weston Broome set a goal of raising that to 25 percent. In addition, city leaders used data to dig into delays in processing professional services. Subsequent changes cut the procurement timeline from 51 to 20 days.

2021 Silver Certification


Created one of the nation’s only Community Vaccination Centers to digitize service delivery and hosted over 1,300 virtual meetings that served over 10,000 participants.


Used a data-driven approach to analyze historic contracting data, identify gaps in contracting with small, minority-women-and veteran owned businesses.


Data helped map health disparities by ZIP code and correlated health data to Census tracts to demonstrate how a person’s residency is directly connected to their quality of life, including expected lifespan, access to food, and exposure to crime.

Using Data to Build a Healthier Baton Rouge

That Baton Rouge has one of the most innovative public health programs in the country might come as a surprise, considering that the Louisiana capital doesn’t have a local health department. Health policy is established by the City of Baton Rouge/East Baton Rouge Parish, a consolidated form of government that encompasses the city and parish (county) limits.

But that hasn’t stopped the City-Parish from addressing its community health challenges in collaborative, creative ways. The centerpiece of this work has been the Mayor’s Health City Initiative (MHCI), which launched in 2010. When Mayor-President Sharon Weston Broome took office, she expanded and grew the program, which is also referred to as “Healthy BR.”

The collaborative, data-driven strategy is enabled in part by the investment Baton Rouge has made in recent years to build a strong data foundation and culture. The City-Parish, for example, has received technical assistance from expert partners through What Works Cities (WWC) to strengthen its performance and analytics, open data, and data governance capacities. By leveraging the City-Parish’s in-house data experts, the MHCI and its partner hospitals have been able to tell a data-driven story that raises public awareness of the troubling extent to which where a person lives determines their health. There is a growing consensus among public health experts that this trend creates disparities across geographic and racial lines.

This reality is highlighted in Baton Rouge’s Joint Community Health Needs Assessment (CHNA), a federally mandated report that hospitals are required to file every three years under the Affordable Care Act. In 2015, the five local area nonprofit hospitals came together to write the nation’s first joint CHNA and joint Community Health Implementation Plan (CHIP). Healthy BR’s 2018 CHNA report ramped up the role of data, mapping health disparities by ZIP code and correlating health data to Census tracts to demonstrate how a person’s residency is directly connected to their quality of life, including expected lifespan, access to food, and exposure to crime.

“The visual, data-driven approach helped heighten awareness among our stakeholders that the social determinants of health make up the majority of someone’s health,” says Jared Hymowitz, who directs MHCI on behalf of Mayor Broome. “And that helps us get traction for this work.” One result of the initiative: The City-Parish has worked with the Humana Foundation and the Blue Cross and Blue Shield of Louisiana Foundation to raise nearly $4 million to address food insecurity in Baton Rouge.

Hymowitz worked closely with the City-Parish’s Geographic Information System (GIS) team to visualize the data for the 2018 report. He’ll do so again for the 2021 version, which will focus on COVID-19 and hospitalization disparities, as well as the correlation between crime and health.

“The exciting thing is that publicly available data is light years from where we were when we wrote the last assessment,” Hymowitz says. “There’s a lot of impactful storytelling we can do around community health challenges.” For example, in 2018, MHCI worked with the Louisiana Department of Health to identify the average age of death by ZIP code. Today, MHCI can estimate a person’s life expectancy based on the Census tract in which they live, generating valuable data and supporting analyses that guide how the community responds to health challenges.

“The goal is simple: build a healthier Baton Rouge. We know getting there requires sharing data and expertise across key organizations. That kind of collaboration is the best way to tackle common health challenges like obesity and diabetes.”

Baton Rouge Mayor Broome

Tapping Growing Data Potential

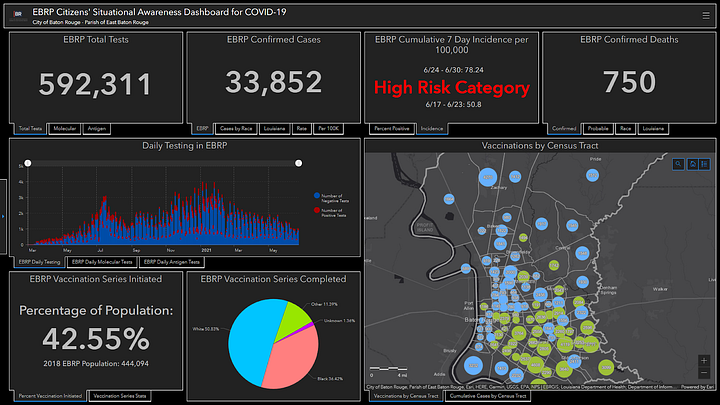
Warren Kron, the City-Parish’s GIS manager, works with his colleagues in the Department of Information Services and GIS section to make such storytelling possible across city-parish governments. During the pandemic, his team helped create a COVID-19 dashboard to provide comprehensive information about virus cases that could help policymakers and hospitals manage the crisis. He compiled information from the Louisiana Department of Health, coroner reports and 911 calls, and then mapped everything.

Baton Rouge’s COVID-19 dashboard. Image courtesy of the City of Baton Rouge.

“We aggregated the data to Census tract geographies to identify the hotspots in our parish, which the Mayor’s Office then used to decide where to set up testing locations and direct other response resources,” Kron says.

Initially for internal use, the dashboard went public in May 2020. During weekly calls, Baton Rouge area hospital administrators, the Mayor’s Office, and other stakeholders used data from the tool to guide key COVID-19-related decisions and coordinate policies. Kron’s team has since automated much of the data to minimize upkeep and maintain current information, and the dashboard now also displays vaccination information. Such initiatives are possible because the City-Parish decided several years ago to consolidate its GIS staff spread across various departments into a single team.

But today, centralized in one office and championed by Director of Information Services, Eric Romero, the GIS team leverages data sets and creates powerful tools that help policymakers and on-the-ground staff deliver services. One example: The GIS team helped city-parish street maintenance crews use geographic data drawn from residents’ 311 service requests to more efficiently fix potholes. Kron’s team built an app that mapped pothole locations, and workers eliminated a backlog of 3,000 pothole requests in three months.

“We have seen tremendous gains in efficiency,” Kron says, noting that while a lot of the data his team manages has been around for a while, it has never been easier to map it and make it digestible. “It’s the application of all this data that matters.”

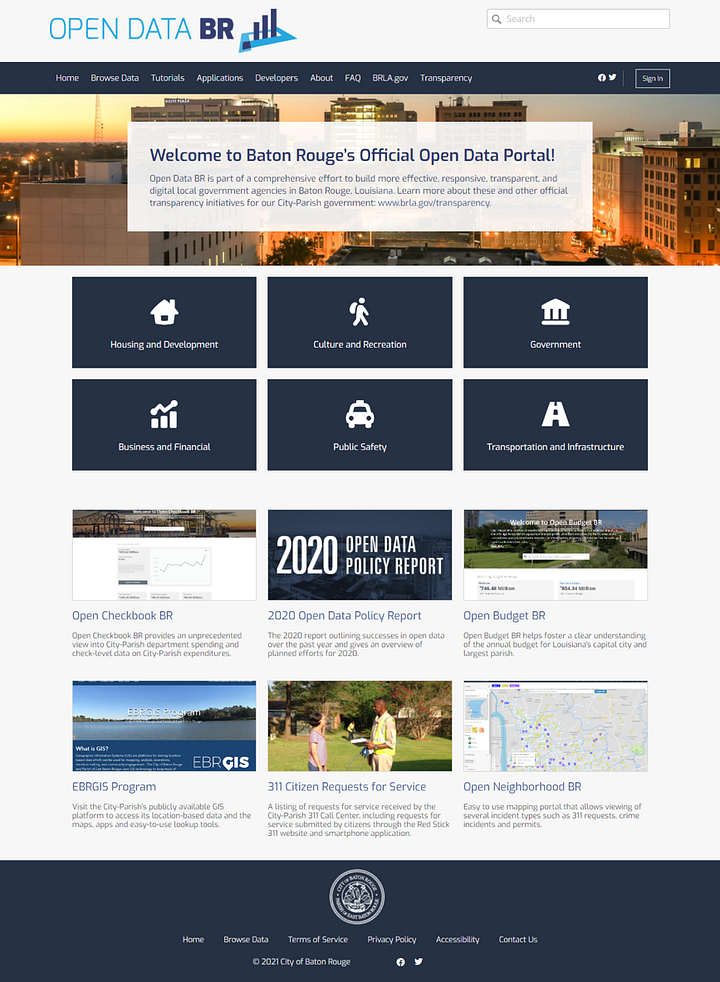
The City-Parish plans to rebrand the GIS team as the data, analytics, and performance office — still within the Department of Information Services, but with a name and function more closely aligned with the role this team serves for city-parish government. This office will serve as the central place for internal and external stakeholders to get data, access analyses, review data trends, and more. That will build on Baton Rouge’s considerable open data resources, which cover everything from the budget and spending to neighborhood-level crime and 311 requests. A core goal of all this work is to empower people with information.

Baton Rouge’s open data portal.

“We want to see residents and the community use data to make their own decisions. The goal is never data for its own sake. All of this work is ultimately about giving people the ability to understand their community, so they can help make it a better place.”

Baton Rouge Geographic Information System Manager Warren Kron
Join Our Certified Cities!

Disclaimer