New York City, New York, USA

A Data-Driven Process to Reach Net Zero Emissions: Climate Budgeting

Project Type:
Health and Wellbeing, High-Performing Government, Youth Development

At a Glance


100% of City agencies have already submitted emissions impact data with all capital project budget requests


April 2024: When NYC will publish its first Climate Budget.


$4 billion: Amount the City will invest in a school electrification plan, which will contribute a 3% reduction in greenhouse gas emissions from government operations.

Climate Budgeting to Help Reach Zero Net Emissions

New York City has a goal to reach net-zero emissions citywide by 2050.

To reach that goal, city leaders must put data at the heart of day-to-day operations. One way the City is doing this is through a new municipal climate budget. As part of the climate budget, the City bolstered requirements for capital project budget requests to include projected emissions data, which are now being met by 100 percent of city agencies, contributing to a 27 percent reduction in greenhouse gas emissions from government operations.

“Climate budgeting is a significant shift in how we think about the value of tax dollars and their potential to power change. It’s the only way to use every budgeting decision to bring our climate ambitions to life. There’s no time to waste.”

Eric Adams, Mayor

Climate budgeting is a governance system that mainstreams climate targets and considerations into decision-making through the budget process and aligns the City’s resources with its climate goals. It is a paradigm shift from the traditional budget process to a holistic approach that considers the impact of every dollar the City spends on meeting its climate goals.

NYC’s climate budgeting is a core component of the City’s strategic climate plan announced in 2023 and is being led by New York City’s Office of Management and Budget, in partnership with the Mayor’s Office of Climate and Environmental Justice (MOCEJ).

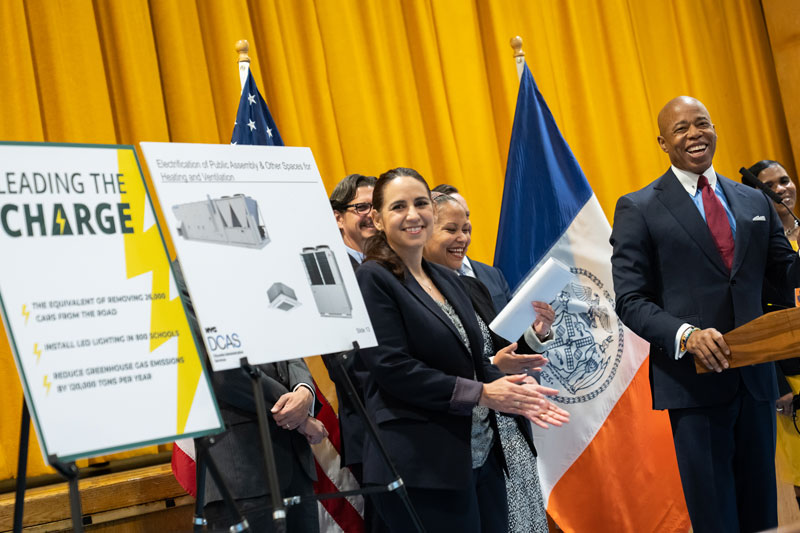
An early example of climate budgeting can be seen in the “Leading the Charge” initiative, a $4 billion plan now in motion, to ensure newly constructed schools will be all-electric and 100 existing schools will begin to phase out fossil fuel heating systems. The initiative will prioritize schools in low-income as well as predominantly Black and Brown communities which are particularly vulnerable to environmental injustices such as elevated rates of childhood asthma. The electrification plan illustrates how NYC is using emissions data to combat climate change and disaggregated demographic data to promote equitable health outcomes.


How else has NYC become a more data-driven government?

As one of the first big cities in the U.S. to adopt climate budgeting, New York City is showing how new decision-making processes can deliver urgently needed change. 

In 2024, it will implement a formal climate budgeting intake form for agency budget requests and publish its first Climate Budget alongside the Executive Budget. The Climate Budget will include a citywide greenhouse gas emissions forecast showing progress toward the 2050 net-zero goal, as well as data that shows how capital project plans could affect climate goals such as air quality and heat and flooding resilience. The 100% compliance rate across departments is a positive sign for standardizing climate budget processes and understanding the City’s emissions.

Does climate budgeting make funding decisions more complex? Yes. But the initiative is worth it. It allows New York City to understand the climate impact of dollars spent and then rally around forward-looking projects aligned to must-reach goals.

“By using a data-driven decision approach, our administration is delivering results for New Yorkers in the most efficient and equitable way possible. Data is more than just a spreadsheet — it is a tool to help government better improve services that impact the daily lives of residents. I’m proud that New York City is recognized as an international leader in operations and look forward to continuing to use data to improve the lives of New Yorkers.”

Sheena Wright, First Deputy Mayor

Syracuse, New York, USA

In Syracuse, Data Delivers Efficient, Effective and Equitable Services.

Project Type:
Equity, Finance, High-Performing Government, Housing, Infrastructure

2023 Gold Certification


Several years ago the City of Syracuse teamed up with the Syracuse Metropolitan Transportation Council (SMTC) to create a data-driven prioritization for road reconstruction. This year, the City and SMTC introduced an equity component to the priority scoring process to ensure that the City does not overlook roads in historically underserved neighborhoods. Inspired by equity score systems in other cities, the City created a metric to measure the amount of historically underserved residents in an area. The new model considers the equity score as well as road conditions when recommending reconstruction projects for the year. In this way, the City avoided completely reinventing the reconstruction priority process while introducing equity as an additional factor.

2021 Silver Certification


Compiled data from GPS units in each snowplow, allowing the city to create and publish an interactive map for residents to determine if a street was already plowed and allowing city staff to quickly identify any streets a snowplow may have missed on its run.


Created a database mapping sidewalks and walkways in 164 parks in order to improve its approach to snow removal, empowering the city to lower the average time to clear paths of snow from 3 days to 6 hours.


Gave city departments centralized access to budgeted and actual financial data, allowing staff to better predict funding needs and allocate resources. Analysis from this data saved the city an estimated $800,000 on salt used for de-icing.


Determined locations for new affordable housing construction by gathering and analyzing quantitative data on the locations of vacant properties and qualitative data from 800 resident interviews.

The Snowiest City

Syracuse, New York is seriously snowy. Averaging more than 120 inches of snowfall each year, it’s officially the country’s snowiest city. Throughout each long winter, staff in the Department of Public Works (DPW) work to keep roads and sidewalks clear and safe so residents can keep moving. Until a few years ago, Syracuse’s snow removal services were challenged, resources were limited, and many residents weren’t happy.

“I used to want to avoid Facebook every time we had a storm,” says Corey Dunham, the City’s chief operating officer. “There were just too many friends and family complaining about the snow on their streets!”

When Mayor Ben Walsh took office in 2018, he was determined to take a new data-driven approach to tackle persistent problems facing Syracuse residents. Whatever the problem in Syracuse today, a first step toward designing a solution is to dig into data. “You can’t fix what you don’t fully understand,” Mayor Walsh said in his 2019 State of the City address. Data helps the City understand the causes of problems and address them, he added.

With clear support from the Mayor’s Office, city staff have worked in recent years to build foundational data practices including general management, performance & analytics, and open data to improve the delivery of city services like snow removal. The aim is to deliver efficient, effective, and equitable services — a goal that has become core to Walsh’s administration.

“We’re not data-driven for the sake of being data-driven. Data empowers us to know if we’re being effective or not, and then pivot when we need to change.”

Syracuse Mayor Ben Walsh

Deputy Mayor Sharon Owens admits she was once a “data nonbeliever.” Now she has the passion of a convert. “Being able to use data to hone in on quality-of-life issues is crucial,” Owens says. “We spend too much time sending out a wide net when we should be honing in. Residents are impacted by our ability to take data and use it to solve the problems they care about.”

Plowing Through Data

The Parks Department and DPW’s effort to overhaul how they prioritize clearing snow from roads and sidewalks shows how data can translate into better and more transparent city services.

During snow events, the DPW snow plows move into action. The department follows a system of prioritizing city streets for snow removal: the first priority is always emergency routes, followed by hills around the city and roads with significantly higher levels of traffic. Flatter city streets generally found in residential neighborhoods come next.

Clearing the City’s streets after a snowfall. Image courtesy of the City of Syracuse.

The City compiled data from GPS units in each snowplow to create and publish an interactive map on the City website, enabling residents and property owners to track the path of snowplows during storms to determine if a street was already plowed. The map includes timestamps of a plow’s most recent pass of a street. The data also equipped the DPW staff to more quickly and accurately identify any streets a snowplow may have missed on its run.

To improve sidewalk snow clearance, the City took a similar approach. Working with the Syracuse Metropolitan Transportation Council, a team of DPW staff members and transportation planners first mapped foot traffic, building a dataset detailing which sidewalks are used most frequently and which are adjacent to the most dangerous streets. Again, data analysis showed the obvious snow removal strategy.

“We determined the most dangerous streets for pedestrians and cleared sidewalks in those areas first. Using data, we were able to make and defend decisions about why we chose to clear certain streets and sidewalks over others.”

Chief Operating Officer Corey Dunham
Image courtesy of the City of Syracuse.

The Department of Parks, Recreation and Youth Programs also dug into data to improve its approach to snow removal. The first step was mapping all the sidewalks and walkways in Syracuse’s 164 parks it is responsible for — 13 miles total, the department learned. Previously it would take three days after a major snow event to clear all sidewalks and walkways. After creating a color-coded map making priority routes clear — and buying two Bobcat L28 machines enabling a sidewalk to be cleared in just one pass — the department now clears them in just six hours.

Syracuse officials have also used more data-driven budgeting practices to save money on road de-icing materials. Previously, each department across the city was managing its own financials and budgeting from budget-to-budget, instead of actuals-to-budget. By centralizing the budget planning process and providing actuals to departments, Syracuse was able to make better spending decisions. This approach allowed DPW to analyze data for how much salt it purchased each year for de-icing and how much salt it actually used. The ultimate outcome: officials were able to better predict how much salt they needed to buy. Last year, the data-driven effort helped the city save an estimated $800,000 on salt purchases.

More Results to Come

Syracuse’s efforts to strengthen its data culture and practices have yielded benefits beyond snow removal. The City has also used data-driven problem-solving skills to address more complex challenges, such as poverty, inequities highlighted by the COVID-19 pandemic, and neighborhood revitalization efforts.

Looking ahead, exciting things are in the works — all fueled by the data capacity Syracuse has built. Later this month, the City plans on unveiling a brand-new resident information system revamping its city service request system into a more comprehensive and user-friendly portal.

And by the end of the year, Syracuse will build the first 25 of 200 one- and two-family housing units through the new Resurgent Neighborhood Initiative (RNI). The program supports city neighborhood planning and revitalization at the block level. Affordable housing construction locations were chosen by analyzing quantitative data detailing the locations of vacant and unused properties, and gathering qualitative data through 800 resident interviews conducted over eight months. This stakeholder engagement helps ensure equity, so the City can better deliver on the promise of affordable housing.

“Whether the challenge is housing, a pandemic, or snow removal, being a data-driven city means efficiently, effectively, and equitably delivering services that taxpayers pay for,” Mayor Walsh says. “This is the nuts and bolts of local government.”

Join Our Certified Cities!

Rochester, New York, USA


Project Type:
Community Engagement, Economic Development, Finance, High-Performing Government, Housing

2024 Gold Certification

Rochester, New York, is making transportation work better for everyone. One out of every four households in Rochester does not have a car and relies on walking, biking and public transportation for daily travel. In 2023, the City used geographic and demographic data to develop an Active Transportation Plan to improve safety and accessibility for pedestrians, cyclists and transit riders. In 2024 the City began connecting 60 miles of bike paths to increase accessibility for residents, and the data-backed plan was awarded a federal Safe Streets for All grant for $23.7 million. Furthermore, Rochester continues its commitment to leveraging disaggregated data, through its first Disaggregated Data Standard with What Work Cities’s support.

2021 Silver Certification


Used a range of qualitative and quantitative data sources, including City-owned and U.S. Census data, to understand the housing market’s structural challenges to help develop affordable and market-rate housing units.


Used data-driven approaches to support projects in vulnerable neighborhoods and targeted investments to help stabilize home values and promoted long-term investments to the community.


Displayed housing data in Rochester’s Development Opportunity Sites initiative so that residents can understand how their government is working to attract businesses and produce more affordable housing and view a GIS-based map detailing investment projects.

Solving the Housing Crisis with Data

In many U.S. cities, residents face rising rents and home prices that put affordable housing out of reach. But Rochester, New York’s housing crisis is different. The city is a soft market in which supply exceeds demand. Median housing costs for homeowners and renters are significantly lower in Rochester than in New York State and nationwide, but high poverty rates and very low incomes still create major affordability challenges. There’s also a basic quality problem: An aging housing stock requires maintenance and upgrades.

“We have one of the oldest housing stocks in the country,” says Elizabeth Murphy, associate planner and administrative analyst in Rochester’s Office of City Planning. Nearly two-thirds of housing units in the city were built prior to 1950 and nearly 90 percent were built prior to 1980.

“That means a lot of deferred maintenance and healthy housing needs.” In many parts of the post-industrial city, houses have deteriorating roofs and mechanicals, as well as lead paint and asbestos. Renovation and remediation needs are high, but given low home values and high poverty rates, rehab or redevelopment at the scale that is needed only makes financial sense with “significant subsidies” in the mix, Murphy notes.

Image courtesy of the City of Rochester.

Rochester’s 2018 citywide housing market study, its first in more than a decade, crystallized officials’ understanding of the housing crisis. Drawing on a range of qualitative and quantitative data sources, including City-owned and U.S. Census data, the study painted a detailed picture of the housing market’s structural challenges as well as key market interventions the City could pursue to help develop both affordable and market-rate housing units. City leaders incorporated the data-driven housing analysis and recommendations into its new 15-year comprehensive plan, Rochester 2034, adopted by City Council in 2019.

“The housing study made the challenges of our market context clear,” says Kevin Kelley, manager of planning. “It also made clear that we need to strategically engage that reality to help reposition and revitalize our neighborhoods.”

Like the housing study, Rochester 2034’s blueprint for growth and development reflects the City’s commitment to foundational data-driven practice areas including stakeholder engagement, performance & analytics, and data governance. It draws on input gathered from over 4,000 community members and over 100 stakeholder groups to set specific, achievable goals across a range of areas — transportation, economic growth and housing among them. Recognizing that Rochester’s housing challenges are multidimensional, the Plan envisions the City playing multiple roles to spark and sustain positive change.

“There’s a spectrum of roles local governments can play with housing,” Kelley says. “In some instances it serves as a charitable giver and in others it plays the role of strategic investor. There’s a time and a place for each.”

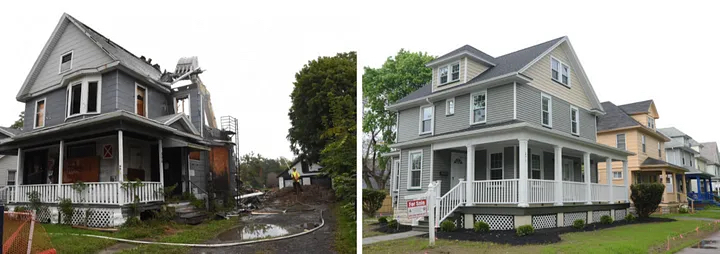
As examples of the former, the City serves hundreds of low-income households each year through grants to pay for housing rehab, new roofs, emergency furnace/boiler/water heater repairs, and addressing lead hazards in pre-1978 housing units. As a strategic investor, the City is looking to take a data-driven approach to support projects in so-called “middle markets.” These are defined as neighborhoods vulnerable to decline where targeted investments could help stabilize home values and promote long-term benefits to the community.

Image courtesy of the City of Rochester.

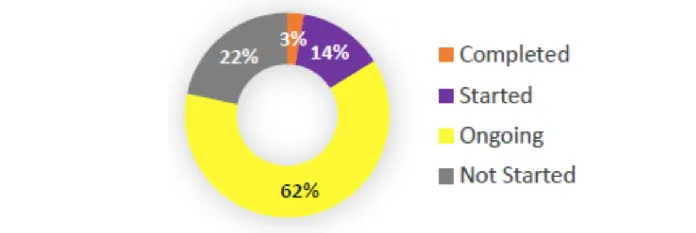
Rochester 2034’s Housing Action Plan set six overarching goals with 37 specific strategies recommended for implementation. Staff track progress on the goals by updating a shared internal reporting site. In its first Two-Year Progress Report since Plan adoption, the City reports that work has been completed on one of the 37 housing strategies and is underway (i.e., “started” or “ongoing”) on 28 of them. Reports that describe overall progress on Plan implementation and provide detailed status updates on specific strategies will be released to the community every two years through 2034.

Image courtesy of the City of Rochester.

Leveraging RFPs and City-Owned Land to Catalyze Change

One of the Plan’s housing goals was to support the production of new high-quality, mixed-income housing that is both affordable and accessible to people across a wide range of incomes, abilities, household sizes, and ages. Rochester’s annual budget now sets specific targets for the number of affordable and market-rate units the City will create; current fiscal year goals are 152 and 103, respectively.

To spur production of units, the City updated its annual Housing Development request for proposals (RFP) requirements for any organization (whether for-profit or otherwise) seeking financial support from the City or looking to buy vacant City-owned land for a housing project. As of this year, to garner City support, developers of market-rate mixed-income projects that do not qualify for affordable housing subsidy programs administered by New York State have to make at least 20% of housing units affordable to individuals or families earning at or below 60% of the area’s Median Family Income (MFI).

Image courtesy of the City of Rochester.

The Rochester 2034 plan has also jump-started more strategic approaches to developing vacant lots; the City owns thousands of parcels across Rochester. City officials are working to customize redevelopment goals and RFPs for City-owned land to better reflect market context, with the goal of stimulating neighborhood development in more targeted ways. In low-demand areas, which tend to be lower-income, parcels may be reserved for businesses that will create durable jobs and thereby stimulate demand for housing. But if the parcel is in a higher-market area, the city may want to use the RFP to spur affordable and mixed-use development.

“We’re taking a more customized approach in how we think about land use and our role as a strategic investor. A basic goal here is to provide more jobs, with better wages, so housing options can become more in reach for folks.”

Manager of Planning Kevin Kelley

Because Rochester’s affordability challenges are rooted in very low incomes, its housing strategy and economic development strategy need to dovetail.

This is on display in Rochester’s Development Opportunity Sites initiative that markets 12 City-owned sites which, officials believe, are well-positioned to help revitalize surrounding neighborhoods. While those sites await buyers, residents interested in understanding how their government is working to attract businesses and produce more affordable housing can view a GIS-based map detailing projects the City has invested in during the last 10 years.

“We’re proud of the progress we’ve made in embedding data-driven governance practices into our culture and grateful to What Works Cities for its support. There’s been a valuable shift in how we think about housing challenges and pursue solutions. In the coming years, I expect our new strategies will deliver more and more results to residents.”

Chief Performance Officer Kate May

Join Our Certified Cities!

Buffalo, New York, USA

In Buffalo, Open Data Practices Help Prevent Lead Poisoning.

Project Type:
Community Engagement, Communications, Equity, Health & Wellness, High-Performing Government, Housing

WWC - Silver Certification Badge for year 2021

At a Glance


Used open data to support community engagement efforts, building partnerships to secure federal funding that helps support safe housing and uses technology to communicate with Buffalo residents.


Communication action plan used advanced data analytics systems to address and eliminate lead poisoning by mapping housing data with public health data in order to target landlord outreach and lead remediation efforts.


Compiled datasets detailing housing inspections, code violations, 311 service requests and more. The city made these datasets accessible to Buffalo residents, giving them information that helps them advocate for their needs.

Safe Housing in Buffalo

One of America’s great 19th-century manufacturing hubs, Buffalo, New York is filled with historical landmarks. Early skyscrapers and Romanesque architecture are a source of pride for the state’s second-largest city. But many other buildings haven’t aged as well.

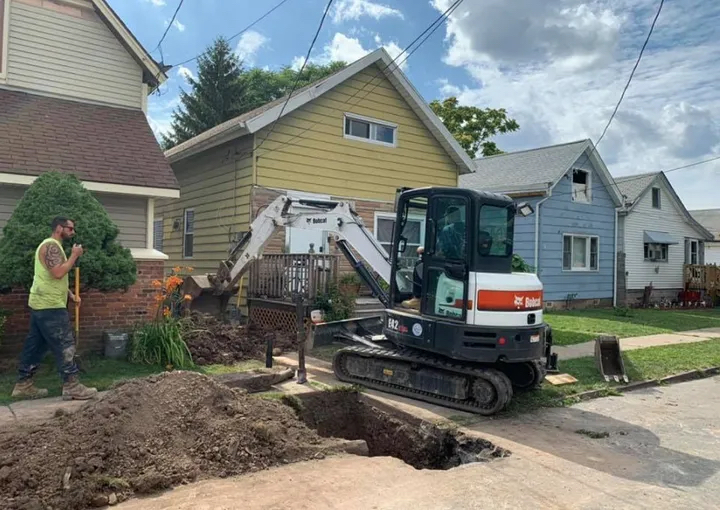
Much of the city’s aging housing stock contains lead paint and other materials that can sicken children. Moreover, lead water service pipes could poison residents if the toxic chemical ever leached into drinking water, as it did in Flint, Michigan. The dangers have been clear for decades. The City of Buffalo received a federal lead remediation grant in the 1990s, but lost the funding due to missed targets.

During recent years, Buffalo has successfully relaunched efforts in no small part due to its strong commitment to data-driven decision making, open data, and stakeholder outreach. The new lead remediation program has rallied city officials, community partners, and residents around a shared vision and created transparency around goals and progress.

As a result, Buffalo secured a new remediation grant from the U.S. Department of Housing and Urban Development (HUD) in 2019, becoming one of the few cities in the country to have received such funding after earlier support ended. Data generated through the initiative has also resulted in new lead-related city ordinances and successful prosecution of noncompliant landlords by the New York State Attorney General.

A lead remediation project. Image courtesy of the City of Buffalo.

“Early on we’d often wonder what is going to happen when landlords realize what we’re doing and decide to fight back,” says Buffalo Policy Director Robert Mayer, who leads the lead remediation program. “But they never did, in part because the narrative we were telling with the data was so compelling.”

The Foundation for Change

The successful restart of Buffalo’s efforts began in 2017 with a comprehensive community action plan to eliminate lead poisoning. The report noted that a stunning 61% of children born in Erie County in 2012 had lead in their blood by the age of three; the majority of those kids lived in rental properties in Buffalo. Children in low-income neighborhoods were more likely to be affected.

The granularity of the public health data, and the racial and socioeconomic disparities it highlighted, created a collective sense of urgency. It also demonstrated that Buffalo understood the scope of the problem and could utilize advanced GIS and data analytics systems to address it efficiently. By mapping housing data with public health data, the City could identify areas to target in its landlord outreach and lead remediation efforts.

“Buffalo doesn’t have a health department, so most previous approaches were based on housing statistics, which provided a good indication of what needs to be done but not a lot of information on the impact of lead poisoning on residents,” Mayer says. “That’s what we needed to demonstrate to HUD and other funders.”

The action plan made clear that the scale of Buffalo’s lead problem went beyond the county’s ability to address it, making the case for additional funding, which it received from the Robert Wood Johnson Foundation and HUD.

Around the same time, Buffalo began working with What Works Cities (WWC) to set up an open data program and create a governance committee with representatives from all city departments. Mayor Byron W. Brown issued Buffalo’s first open data policy in August 2017.

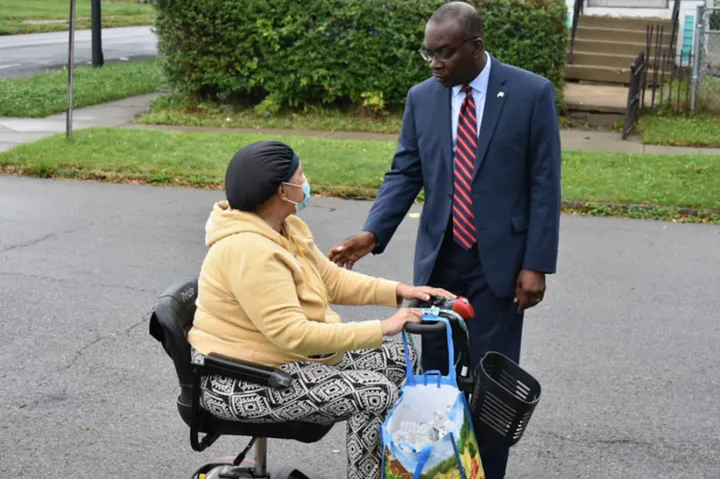
Mayor Byron W. Brown greets a resident. Image courtesy of the City of Buffalo.

“Prior to Mayor Brown beginning the What Works Cities Certification process, it was very easy for information to get siloed. By breaking down those siloes, it has eased information-sharing internally, but also with external partners.”

Buffalo Policy Director Robert Mayer

Open Data, Community Outreach Deliver Results

Lou Petrucci, then Buffalo’s deputy commissioner of permit and inspection services, realized how the open data initiative could support lead remediation efforts. He pushed to make data from his department publicly available. By pairing data detailing housing inspections, code violations, and housing court cases with broader lead assessment information, 311 service requests and U.S. census socioeconomic data — and then making it all public — the City made a powerful case for action and strengthened the program’s efficacy.

“By putting all that information out there, residents have the same access to information that the people in City Hall do. The community advocates now have access to an incredible amount of information to tell a story about what’s happening in their neighborhoods and make informed decisions.”

Buffalo Open Data Director Kirk McLean

In November 2019, the City launched a pilot effort supported by the new HUD grant. Officials reviewed available data to identify 1,500 problem properties belonging to landlords that had been difficult to reach. Then it launched a multi-prong stakeholder engagement strategy. Community health workers conducted seminars and training in those neighborhoods to reach tenants. City building inspectors attended community events to get to know residents. Case workers went door-to-door with lead safety kits and information on how to get a free inspection.

This on-the-ground outreach resulted in contact with all the homes in the pilot and proved instrumental in gaining residents’ trust to allow interior lead inspections in nearly 400 properties that year. Without data to identify high-risk homes to target, the endeavor would have been too time-consuming and costly to undertake.

“If it wasn’t for me and the two inspectors going out to every block club event and other community events on weekends, I don’t think there would have been the trust and confidence we saw,” says Mike Ramos, lead supervisor in the Department of Permit & Inspection Services.

The inspections led to additional data about each home that has helped Buffalo justify ongoing funding from the federal government for lead abatement resources. The pilot has proven that a data-driven approach can deliver results, making Buffalo homes safer for its residents.

It also led to stronger local laws governing rental unit inspections. In the summer of 2020, City staff participated in a WWC City Solutions Sprint focused on housing stability, which detailed how proactive rental inspections can combat lead paint in homes. Staff members then began working with Buffalo’s city council to draft updates to ordinances related to rental units and lead-based paint inspections; the council unanimously passed the Proactive Interior Inspections legislation in late 2020.

Open data detailing the enormity of the city’s lead problem helped spur the council into action, Mayer says. Supported by HUD funds, the City now has a goal of inspecting 6,000 units each year.

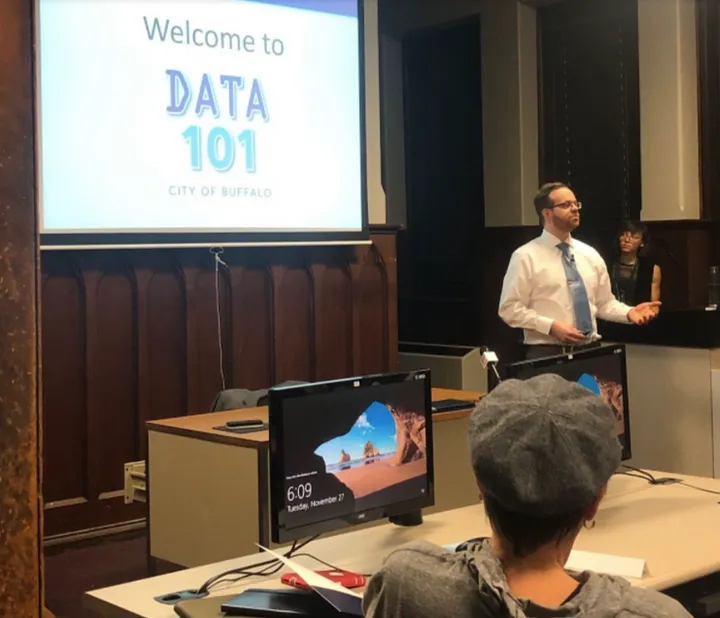
The City of Buffalo created Data 101, a four-session course that teaches participants how to use Open Data Buffalo. Image courtesy of the City of Buffalo.

Data also spurred action at the state level. City leaders sent data gathered during the pilot about one landlord’s properties to the New York State Attorney General’s office, which then used the information in a successful prosecution. That action put all landlords on notice to take lead remediation more seriously, says Cathy Amdur, the current deputy commissioner of permit and inspection services. She explains that the landlord had been operating under multiple names and through various associates to skirt the law.

“Twenty years ago, we would not have had a way to know that 10 different iterations of the same company were all the same. That’s what open data allows us to do.”

Deputy Commissioner of Permit and Inspection Services Cathy Amdur

Join Our Certified Cities!

Disclaimer