
Rock Hill, South Carolina, USA

Public Transportation Steered By Data

Project Type:
Community Engagement, Environment, Health and Wellbeing, Transportation

At a Glance


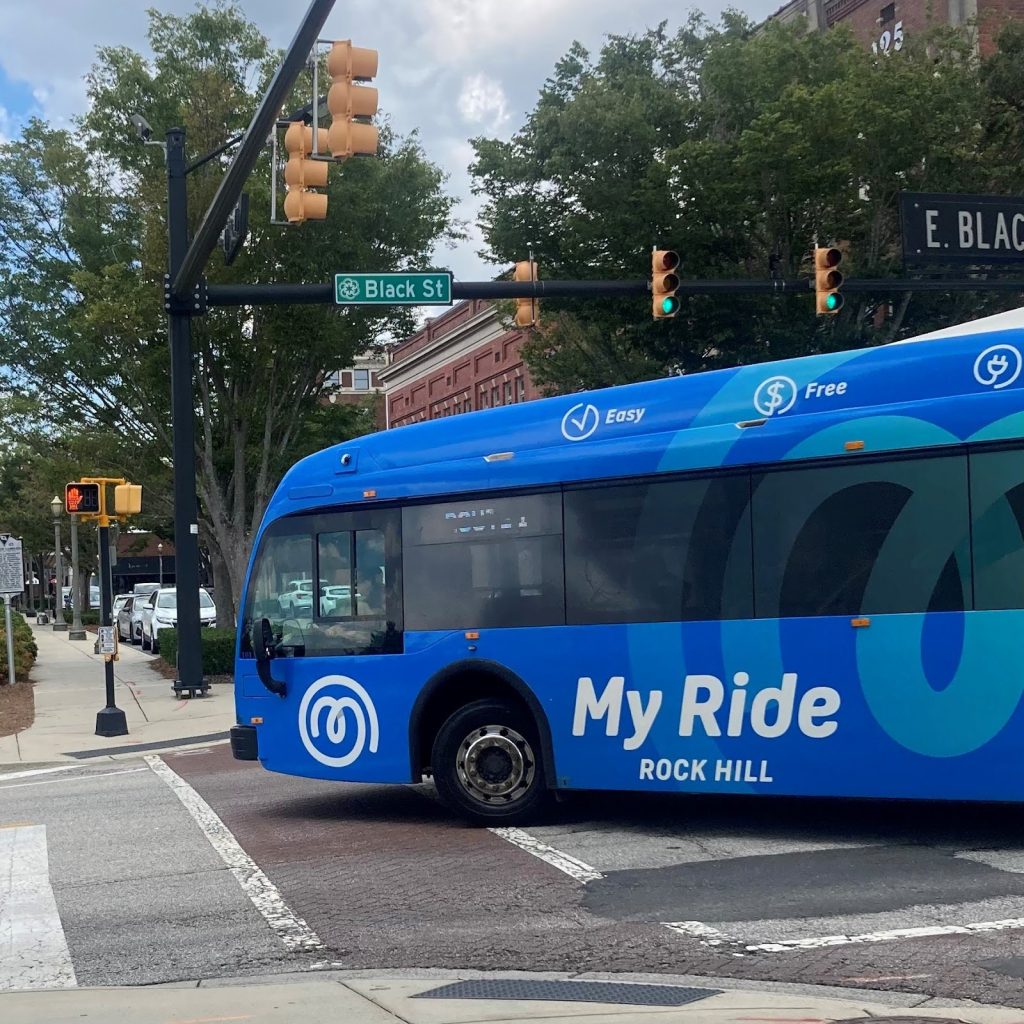
The percentage of residents who report using public transportation has more than doubled since their fare-free, all-electric public buses began in 2019.


More than 700 alumni of a 10-week civics course provided to residents by the City.


Increasing tree canopy by planting three trees for every one tree the City cuts down.

Rock Hill, SC, tried public transportation in the 1990s. It wasn’t a roaring success; people didn’t know about it and ridership was low. However, in 2015 a Winthrop University survey found that 80% of respondents identified transportation as a top need. With that data point, Mayor John Gettys knew it was time to give public transportation another go.

Data was a guiding force from the start. The City paired the survey with qualitative data from focus groups that also said fixed-route transit would minimize barriers and provide opportunities to residents. With the need established, choosing routes and schedules were the next items on the agenda. Again, the City leaned on resident feedback, partnering with United Way to hold interest meetings. At the same time, regional planning associations used census data and maps to plot routes that would most benefit residents who needed it most. For instance, they didn’t just look at neighborhood density, they looked at where residents without cars lived, and they made sure that routes passed parks, shopping centers, health care facilities and other places residents recommended.

Image Courtesy of the City of Rock Hill.

“The reason we accomplish big things is that we use data to drive decisions, something the City has done consistently over the last 20 years. I think being strategic and utilizing data to solve challenges attracts good representatives who want to come in and do big things, good things for our community.”

John Gettys, Mayor

“Basing decisions on data can minimize the vitriol of partisan politics, it’s an antidote to a lot of the divide we see in our country today.”

John Gettys, Mayor

My Ride not only improves accessibility, it’s making a more sustainable Rock Hill. The fleet of 10 buses are all electric and produced in South Carolina. The buses reduced about 337 metric tons of CO2-equivalent emissions compared to diesel buses in just their first year, they’re also quieter for riders and cost less to operate.

Data guided My Ride’s funding decisions as well. Evidence showed that it was cost-prohibitive to collect fares, and city leadership knew how much the buses contributed to accessibility. Thus, the buses are fare-free. Federal Transit Authority (FTA) funds help meet the majority of the costs, the rest is covered by the City and partner organizations.

As My Ride’s success grows, so too do the City’s ambitious goals for the bus system. When the program started, their ridership goal was 4,100 passenger trips per week—a goal they met in less than two months. Despite the plunge in ridership due to the pandemic, ridership has bounced back. In FY23, My Ride’s monthly ridership goal was 16,400. They averaged 20,839 passenger trips per month. And they did all of those rides with only three customer complaints the whole year.

This isn’t the end of the line for My Ride. The four, hour-long routes already serve about two-thirds of city residents, and the City is constantly collecting feedback and setting goals for improvement. For example, in 2023 My Ride began to serve additional areas on the existing routes and improved system efficiency.

Join Our Certified Cities!

Charleston, South Carolina, USA

Creating a One-Stop-Shop to Track Progress on City Goals.

Project Type:
Community Engagement, Environment, Equity, Housing, Infrastructure, Public Safety, Technology

At a Glance


Charleston’s TIDEeye app helps the city and its residents monitor the effects of severe weather by providing real-time data on road closures and weather information.


Charleston has added almost 800 affordable housing units since 2016, and 500 more currently in the pipeline.


Data has shown that 86% of the affordable housing units in development are within .5 miles of public transit.


Known as a tourist destination with idyllic horse-drawn carriages, the City optimized equine waste management with GPS tracking. The system helped reduce cleanup time from 40 minutes to 20 minutes.


Using outcomes-based performance management practices to understand if programs are achieving their intended impact.

For cities with competing priorities and limited resources, making city-wide strategic goals built on data and evidence is an achievement in itself. But tracking progress, engaging residents and strengthening accountability is a tougher feat.

In 2022, the City of Charleston outlined six mayoral priorities and launched PriorityStat, an online dashboard and public meeting series to increase transparency and help the City and residents track progress on these six goals. While traditional city open data dashboards are organized around departments or services, PriorityStat takes a more innovative approach and is centered on City—and residents’—priorities.

For instance, FloodStat, one of the dashboards, is focused on protecting the City from sea level rise and flooding. In the 1950s, Charleston was impacted two  days per year on average by nuisance flooding. In the past five years, that average is now 61 days per year. Traditional dashboards would have relevant metrics, such as police complaints about flooded roads and properties, and city carbon emissions, in different dashboards since they’re in different departments. But addressing flooding and coastal challenges requires many departments to effectively work together. FloodStat helps break down silos by developing and regularly tracking metrics that require cross-agency collaboration. Additionally, it gives residents one place to see a more complete and clear picture of how the City is combatting its challenges.

Another one of the mayoral priorities is affordable housing. Home prices have jumped 78% since 2011 in Charleston—an unsurprising trend for a City with a 25% population increase since 2010 and more than 7 million visitors each year.

HousingStat allowed Charleston officials to develop a 10-year comprehensive plan to improve housing. To eliminate affordability gaps by 2030, the City learned that it needs more than 16,000 affordable units. HousingStat has also led to new programs, such as a Senior Homeowner Initiative, that has already helped 18 seniors become first-time homeowners. Regularly disaggregated data has helped the City allocate resources where they are needed most and develop more targeted strategies.

“We’ve been able to cut red tape on affordable housing initiatives. This is the largest, most ambitious affordable and workforce housing initiative in our city’s history.”

John Tecklenburg, Mayor

The City is clear that PriorityStat is still a work in progress. Two more dashboards are on the docket for 2024: one for mobility and transportation, and the other for neighborhood livability and resident quality of life. While these are being built, the City is actively seeking feedback and encouraging residents to watch public meetings on Charleston’s YouTube page.

PriorityStat is a performance management grand slam for the City. But more importantly it’s a win for residents. An unwieldy and unorganized performance management dashboard isn’t a platform that performs for residents. Charleston’s PriorityStat is different: by embedding accountability, transparency and collaboration into the fabric of the City’s strategic goals, residents know the City is making strides with them in mind.

Join Our Certified Cities!

Disclaimer