Fort Worth, Texas, USA

Smart Water Conservation, Big Savings

Project Type:
Infrastructure & Utilities, Technology, High-Performing Government

At a Glance


Enhanced water infrastructure to provide real-time data for better resource management, leading to a 90% reduction in field investigations and more than $1 million in cost savings.


Installed 290,000 new smart water meters between 2019 and 2022.


Used data to ensure that the federal financial assistance available during the pandemic was reaching customers who had the most need.


23 systems sending data into Fort Worth Water’s central database, detailing work orders, customer usage and payments, water main breaks and more.

When water pipes leak, the City of Fort Worth loses money. Without its own aquifer or reservoirs, the City buys its entire supply—82 billion gallons in 2023—from Tarrant Regional Water District for over 1.4 million customers in Fort Worth and 33 surrounding communities. When water is conserved, the financial benefits are tangible: Less water needs to be  purchased (and treated), reducing operating costs.

This was a major impetus behind MyH20, a program launched in  2016 to both establish a more data-driven approach to water infrastructure management and maintenance and enable customers to better manage their water use.

The first step was installing nearly 300,000 new advanced water meters across Fort Worth Water’s service area. With near real-time data wirelessly transmitted to the utility, customers who register in the online portal are now alerted when possible leaks (i.e., continuous water flow) are detected on their property. Plus they can track usage and pay bills via the online portal. Meter and billing information now flows into a central data management platform, allowing Fort Worth Water to more easily identify who is behind on bills.

When federal water bill assistance was available during the Covid-19 pandemic, the utility was able to use the data to determine if those in danger of service termination for non-payment were the ones receiving assistance through the Low-Income Household Water Assistance Program (LIHWAP), which was managed by third-party entities. (The LIHWAP program is no longer in place.)

Also, MyH20 has dramatically improved Fort Worth Water’s ability to understand the cost of water main leaks and prioritize pipe replacement projects. The utility is now able to systematically track and analyze not only the location of leaks but also the age and type of pipe leaking. Of course, officials knew that older pipes were more likely to have problems. But the ability, for example, to show that cast iron pipes accounted for 92% of water main breaks in 2023—and then detail the exact cost of those breaks—helps build the case for infrastructure improvements. This year, City Council doubled funding for the utility’s pipeline rehabilitation program, allowing it to replace 20 miles of cast iron pipes per year, rather than only 10. The most at-risk pipes are being replaced first.

These upgrades do more than ensure more reliable water service across the city. Strategically upgrading infrastructure—along with helping residents manage their water use—means the entire system loses less water and keeps costs down. Long-term it means less service disruptions to customers. That’s good for the planet, the City and paying customers.

“Because we can use data from multiple systems to see what is happening, we are able to refine our models and improve the water loss estimates for each leak and main break.”

Shane Zondor, Assistant Director of Management Services, Water Department

“We’re building a culture where you have to have data to make decisions, to make recommendations to City Council on policy initiatives. Momentum is building: When people see that data is the key to the treasure, to resource allocation, then they start using data and tracking outcomes.”

David Cooke, City Manager
Join Our Certified Cities!

Sugar Land, Texas, USA

Where Data and Curb Appeal Aim to Make a Stronger City

Project Type:
Community Engagement, Equity, Health and Wellbeing, Technology

At a Glance


Used the Neighborhood Health Report, which included GIS data on population stagnation, aging housing and code violations, to create a home renovation program which targeted investments of over $2.7 million to upgrade 166 Sugar Land homes (145 projects have been completed.)


95% of participants said the program significantly influenced their decision to renovate their homes.


Redevelopment is one of the city’s “All-In” Initiatives using cross-departmental collaboration and performance management to make progress on complex challenges.


Another All-In Initiative is to increase the City’s data-driven decision making and is led by a four-person “What Works Cities team”

Neighborhood blight is not something you hear much about in Sugar Land, a prosperous suburb that frequently ranks near the top of “best places to live” lists. And city leaders want to keep it that way.

But here’s the challenge: The first wave of subdivisions that began Sugar Land’s transformation from small town into a city of 110,000 are reaching middle age. Some of the homes built in the 1970s and ‘80s are starting to look rough around the edges. Property values are linked to a city’s economic health. Declining property values can discourage community investment, reduce revenue for the City and make it hard to attract new residents. 

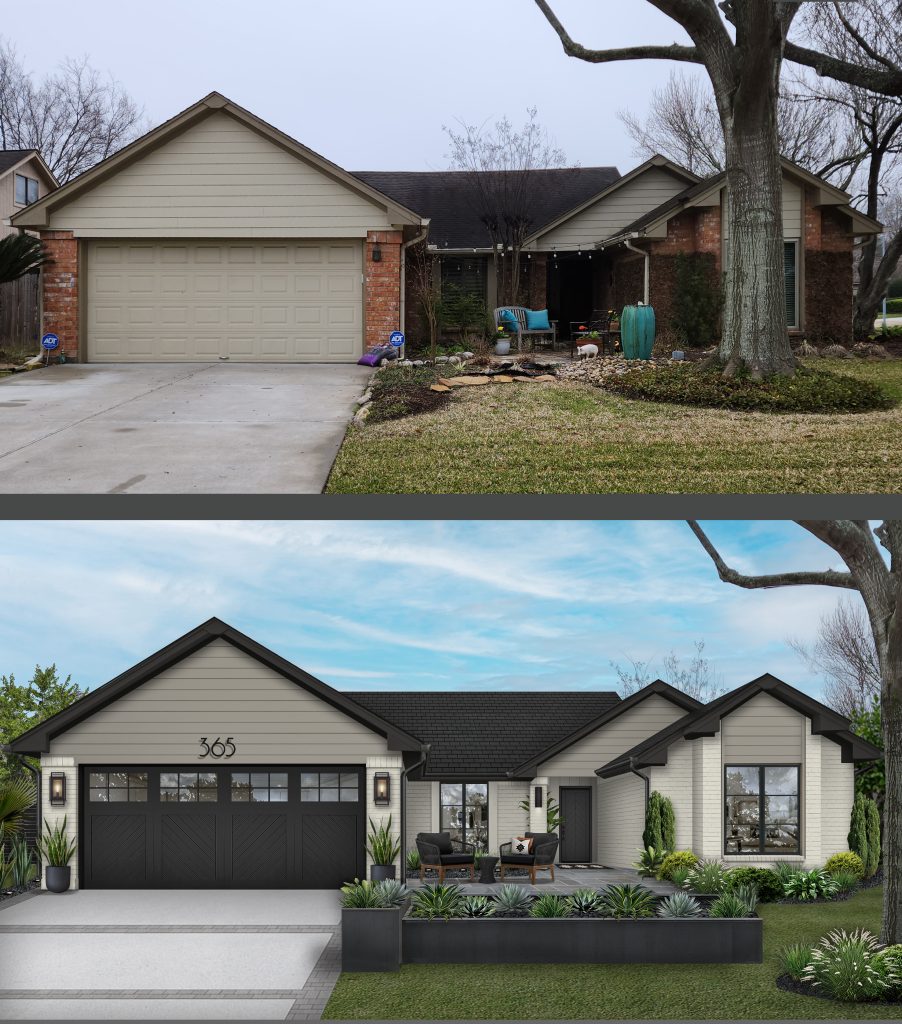
In response, Sugar Land recently launched a successful program called Great Homes Update. It encourages homeowners to take on external home upgrades like painting, garage door replacement, or driveway repairs. And it’s built from top to bottom on data that city leaders used to understand the problem, rally political support, and devise a solution that meets residents’ needs.

Great Homes is one product of what Sugar Land leaders call their “All-In” initiatives. These are cross-departmental collaborations aimed at using a performance management approach to make progress on complex challenges. Redevelopment in a mostly built-out city is one of those All-In initiatives. Improving data-driven decision making through What Works Cities coaching is another. 

To start, leaders conducted a neighborhood health report, mapping the age of homes across the city and where the most code violations were happening. They also sent staff out to different neighborhoods to do a qualitative assessment of the conditions of homes’ roofs, fences, and driveways. 

Next, they surveyed residents to make sure they understood the problem from the homeowners’ perspective. Residents confirmed that they would, indeed, implement improvements if a financial incentive were available. Before designing a pilot program, city leaders looked at how home-improvement programs work in 22 communities across the U.S. Their efforts to find evidence-based solutions in other cities paid off: The pilot they devised won nearly unanimous support from the City Council in February of 2023.

An example of the potential impact of exterior home renovations supported by the Great Homes program. Images Courtesy of the City of Sugar Land.

Through the program, owners of single-family homes are reimbursed for a portion of the cost of exterior house repairs, up to a maximum of $10,000. The City gave a higher rebate percentage to older homes and homes with less than the county’s median home value. .Another program offers owners of single-family houses and homeowner associations discounts on home design services. To make it easy for residents to find out exactly what benefits they’re eligible for, the City developed an easy-to-use address lookup tool based on resident feedback. 

Results from the first year of Great Homes were impressive. Homeowners carried out more than 145 home projects, including house painting, repairs to roofs and siding, and landscaping. The total of all repairs incentivized through the program was $2.3 million, with about $500,000 of that coming from city coffers. In follow-up surveys, users of the program overwhelmingly agreed that the City’s reimbursements influenced their decision to make home repairs. 

City leaders continue to use data to evaluate and improve Great Homes. Under a new iteration of the program, the list of eligible projects has expanded to include front door and gutter replacement.

In the long run, Sugar Land hopes the program will help make the City competitive with nearby areas and deter decline, helping to sustain a prosperous Sugar Land.

“What Works Cities Certification gives our organization a beacon to show: This is where we’re going and this is how we’re going to do it. We don’t need to create our own playbook.”

Mike Goodrum, City Manager
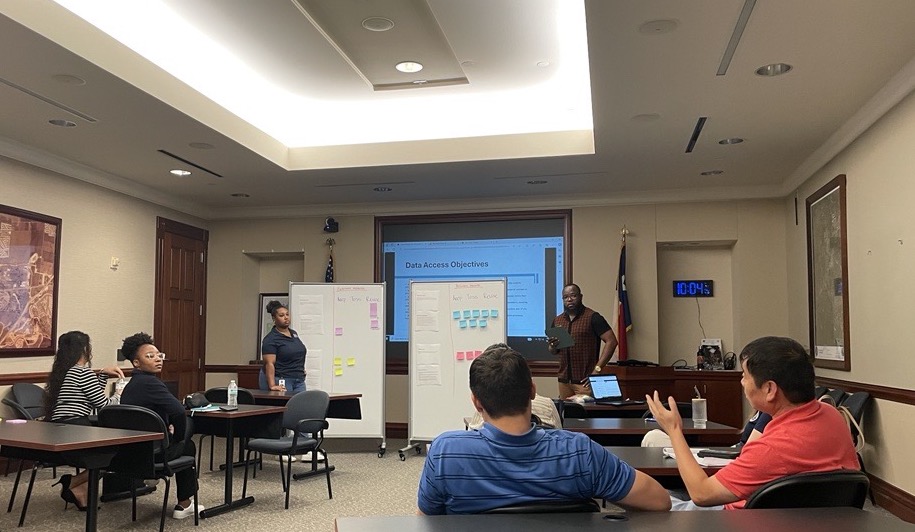
A data strategy brainstorming meeting. Image Courtesy of the City of Sugar Land.

“It’s a community effort that the program is inspiring. Keeping our neighborhoods in good shape is very important for the community.”

Joel Sanchez, Sugar Land resident and Great Homes participant

Residents leveraged about $500,000 in City funds to make more than $2.3 million worth of home improvements.

Join Our Certified Cities!

Dallas, Texas, USA

An All-In Approach to More Equitable Budget Decisions

Project Type:
Community Engagement, Environment, Health and Wellbeing, Transportation

At a Glance


Used disaggregated data to drive budget decisions that address inequities based on race and/or income. All 42 city departments contributed to the establishment of over 220 metrics that are tracked publicly through the Racial Equity Plan, of which $40 million was allocated towards equity investments.


Launched the first Spanish-language 311 mobile app of any big city in Texas.


Reduced the number of steps in the procurement process from 82 to 23, speeding up the time it takes the city to purchase goods and services.

City leaders in Dallas know that if you want to get something done in local government, the budget is a good place to start. So when they took on the goal of creating a more equitable city, that’s exactly what they did.

The result is a process Dallas calls Budgeting for Equity. Rooted in sophisticated data practices, it’s one of the most robust City Hall systems in place anywhere for identifying and addressing disparities.

The effort began in 2019, with publication of the Dallas Equity Indicators report. The report measured equity across 60 social and economic indicators, from business ownership to home loan denials to kindergarten readiness. It also provided baseline data for local leaders to track citywide equity changes over time.

Next, eight departments used the equity indicators to identify disparities and change budgets to address them. For example, the 311 customer service center noticed that wait times were longer for Spanish-speaking residents. In response, the department hired bilingual staff and recently became the first big city in Texas to launch a Spanish-language 311 mobile app.

Budgeting for Equity has since expanded across all of city government. It’s led by the Office of Equity & Inclusion –in collaboration with the Office of Budget Management Services which guides the City’s 42 departments as they use a tool the Office created to help them prioritize equity in their budgets. Departments are required to use disaggregated data so they can spot disparities within the services they provide by race, ethnicity, age and other factors. They also must consider how their budgets may produce both positive and negative impacts in communities of color and lower-income neighborhoods.

“It’s easy to talk about the ways we’re helping people,” says Dr. Lindsey Wilson, Dallas’ Director of Equity & Inclusion. “But how are we also burdening communities? We need to not only talk about the good things but also the not-so-good things that data is telling us.”

What makes Dallas’ efforts stand out from what other cities are doing is its thoroughness. Budgeting for Equity is not an occasional activity for a handful of departments at a time — in Dallas, every department does it every year. The process is aligned with a comprehensive Racial Equity Plan the City Council adopted in 2022, which includes a set of “Big Audacious Goals” meant to guide implementation of that plan; progress is continually tracked in a public dashboard. Individual departments in charge of libraries, arts and culture, planning, and water, have earned recognition from their own industry organizations. 

“Each year we hear from departments about adjustments we need to make,” Dr. Wilson says, noting that the number of questions departments are asked to answer through Budgeting for Equity has been reduced from ten to five to reduce burdens on them. “The one thing that never changed was the use of data to drive the outcomes.”


60 citywide measures included in Dallas’ Equity Indicators Report


3,203 individuals and 284 organizations were directly engaged in creation of the Racial Equity Plan.


5 “Big Audacious Goals” in the Racial Equity Plan

“If we continue to strengthen and hold ourselves accountable for this work, we should see disparities decrease and begin to see transformative change.”

Dr. Lindsey Wilson, Director Dallas Office of Equity & Inclusio
Join Our Certified Cities!

San Antonio, Texas, USA

Innovation & Problem Solving for the People in San Antonio.

Project Type:
Cross-Sector, Education, Finance, High-Performing Government, Infrastructure

2023 Gold Certification

Concerned about an uptick in the number of older homes being demolished, the City of San Antonio and community stakeholders gathered data on the impacts of demolition and possible alternatives. They found that over the past decade, $16 million worth of salvageable building materials and 170,000 tons of waste had been sent to landfills through the demolition of homes built prior to 1960. Demolitions were also releasing airborne toxic pollutants into neighborhoods with larger numbers of Hispanic households and households with lower incomes. In 2022, the City Council adopted a deconstruction ordinance to advance the City’s health and equity goals, create jobs and preserve affordable housing.

2021 Silver Certification


Trained city staff in data analytics to develop better cross-departmental solutions that focus on improving resident outcomes.


Launched an app to streamline students’ digital access to public libraries and school library resources.


Created a Budget Equity tool that considers racial and economic equity in the budget-making process by using data and evidence to ensure services reach areas of need.

The Beginning of Data

One-hundred years ago, a hurricane hit Texas and caused severe flooding in San Antonio. To prevent future floods, architect Robert H. H. Hugman proposed connecting different portions of the City’s central storm sewer system into a loop connecting to the San Antonio River, setting the stage for pedestrian promenades, boat tours, and new businesses. It took a few decades to build, but the Riverwalk is now an iconic part of the City visited by about nine million tourists a year. It stands as a prime example of San Antonio’s tradition of problem solving that continues to drive the City forward in the 21st century.

Today, that tradition is alive and well in the City’s Office of Innovation. It was founded amidst the financial crisis of 2008, tasked with finding ways to do more with less. Over the last 10 years, however, the focus of the office has expanded beyond identifying process improvements and efficiencies. In recent years its staff has begun working with departments across the City to build a data-oriented culture, with a focus on foundational practices including performance & analytics, evaluations, and general management.

The City of San Antonio, Dillard says, is a highly collaborative place where silos are being dismantled in favor of creative partnerships that tap into and cultivate talent. A notable example of this: the City’s Innovation Academy, which is a joint project of the Office of Innovation, the City’s HR department, and Alamo Community Colleges (ACC). Launched in 2020, the Academy trains creative problem-solvers across city departments who have leadership potential and a proposed innovation project toward which they want to apply new skills.

ACC offers city staff intensive courses customized to meet the needs of the City in three specific areas: process redesign, human-centered design, and data analytics. The Academy runs two cohorts a year; participants attend 14 full-day sessions spanning 10 weeks and collaborate on projects. The Innovation Academy’s current cohort comprises senior leaders from across departments and members of the IT department. The idea is that mixing staff from different parts of government helps break down silos, and Academy graduates will pass on their knowledge to colleagues and the staff they manage.

“The structure of Innovation Academy operates like a virtuous cycle, with each cohort helping to build the ecosystem for innovation. It’s a force multiplier.”

Senior Innovation Specialist

Data plays a foundational role in the Academy — and increasingly, in the City itself. “We believe that if you can’t measure it, you can’t manage it. This idea is core to the academy and it’s helping us report on the value of graduates’ projects,” Reat says. Those projects are already having a positive impact on the lives of residents across San Antonio.

“We know that in so many ways, the future of city governance lies in data-driven innovation. I like to think of the Office of Innovation as the engine moving us forward.”

Chief Innovation Officer Brian Dillard

Big Life for Digital Readership

A project backed by the San Antonio Public Library (SAPL) last year offers a prime example. Academy graduate David Cooksey, formerly SAPL’s performance and innovation manager, recognized that digital readership among local schools could be improved if students had a more streamlined way of accessing public libraries and school library resources.

Using techniques learned last year in academy courses, Cooksey worked with OverDrive, a digital distributor of ebooks and audiobooks, to launch an app called Sora. It gathers more than 250,000 digital reading resources offered by city schools and SAPL into one place — no library card required. The initiative helped exponentially increase digital readership among San Antonio school children during the COVID-19 pandemic. About 1,300 digital books were read by children per month in fall 2019, before Sora; 18,000 books were read per month in fall 2020.

After a successful pilot in San Antonio — where Sora is now used by nearly all 17 public school districts — OverDrive began partnering with other city governments to offer Sora through libraries and schools across the country.

An R&D League cross-sector team work session. Image courtesy of the City of San Antonio.

Along with the Academy, the Office of Innovation operates the R&D League, which creates cross-sector teams to evaluate new ideas using the scientific method. The basic idea is to make sure proposed policies and programs are evidence-based before being implemented citywide. “The R&D League really explores the frontier of innovation and evaluation,” says Kate Kinnison, R&D administrator in the Office of Innovation. “I like to think of us as scientists who run experiments.”

In fact, the League does source scientists from partner organizations. Experts from Southwest Research Institute, NASA’s biggest contractor; the University of Texas at San Antonio, the largest research university in the City; and USAA, a San Antonio-based Fortune 500 financial services company, all provide experts to help city departments realize their visions.

Since launching last year, the League has developed four “experiments,” each of which states a hypothesis and research questions. One project is equipping city waste management vehicles with sensors to identify and collect reliable data on infrastructure needs such as potholes.

A data-collecting sensor installed on the roof of a City waste management vehicle. Image courtesy of the City of San Antonio.

Another effort involves three randomized control trials supported by The Behavioral Insights Team (BIT), a What Works Cities expert partner. The aim is to better understand how residents prefer to receive information from the City and how they engage with it, so departments can better coordinate and deliver services. Results from two trials will inform strategies for engaging and communicating with residents; the third trial involves a survey aiming to surface resident needs so the City can better support communities.

“Ultimately, we hope to leverage experiment results to more effectively provide the services residents want. It’s all about responsive, evidence-based policymaking — that’s the goal.”

Research & Development Specialist Rhia Pape

Join Our Certified Cities!

Irving, Texas, USA

In Irving, A Court Meets Residents Where They’re At.

Project Type:
Community Engagement, Communications, High-Performing Government

WWC - Silver Certification Badge for year 2021

At a Glance


Lowered its Failure to Appear rate in court by over 21% using data-driven evaluations such as scheduled reminders and staff calls, giving the city an opportunity to humanize the criminal justice system and reduce fears of court.


Revised its final reminder scripts through a data-driven process involving control and experimental groups in order to help recipients be more receptive to the information.


Used existing data and historical data gathered through focus groups and surveys to answer questions that helped City Council engage better with their community.

Lowering FTA rates

Providing quality, reliable services may be the essence of city government. In Irving, Texas, a suburb of Dallas that has been recognized for having the single-most diverse ZIP code in the country, meeting this day-to-day expectation of residents isn’t a business-as-usual proposition. It’s an opportunity to provide excellent customer service grounded in respect for residents.

“I’ve worked here for 27 years, and this city gets better every year because there’s an expectation to treat people with dignity,” says Wayne Lambert, the City’s municipal court director. “That’s entrenched in our values, and it applies to our work in the courts. Our job is to ensure every person has access to justice and receives high-quality service.” Hitting the mark requires listening to residents’ needs and embracing a continuous-improvement mindset, he adds.

Irving’s work in recent years to improve its municipal court’s Failure to Appear (FTA) rate shows what is possible when cities invest in foundational data practices and use data-driven evaluations to test and fine-tune new approaches. The City’s FTA rate is calculated based on the percentage of individuals who fail to appear in court for a scheduled pretrial hearing. In 2018, Lambert and his staff realized the average monthly FTA rate was 28.2 percent at Irving’s Class C Misdemeanor Court, which handles issues like traffic cases, city ordinance violations, and public intoxication. In other words, more than one in four people were not showing up for pretrial hearings. “From an administrative, equity, and taxpayer perspective, it was a problem we knew we needed to address right away,” Lambert says.

A high FTA rate is problematic for multiple reasons. It costs the City money and staff time to process additional paperwork. Those taxpayer dollars could be better used to support other city services. And then there are the negative impacts on defendants, which can spiral. Receiving an FTA can lead to issuance of an arrest warrant and potential related fees, and contact from a collection agency if fees are not paid promptly.

Yet in many situations, FTAs do not occur due to intentional avoidance. Some common reasons include lack of child care, the inability to take work off, and forgetfulness — Lambert’s team encountered all these issues in Irving. In the medical sector, studies show that patients don’t show up for between 15 percent and 30 percent of medical appointments. Court FTA rates across the U.S. are in the same range. To lower Irving’s FTA rate, Lambert’s team took a cue from doctors’ offices that call patients with appointment reminders. The City’s court staff began reminding residents a few weeks ahead of any scheduled court date, and then again just days ahead. Staff placed the calls, which gave the City an opportunity to humanize the criminal justice system and reduce many residents’ fear of court.

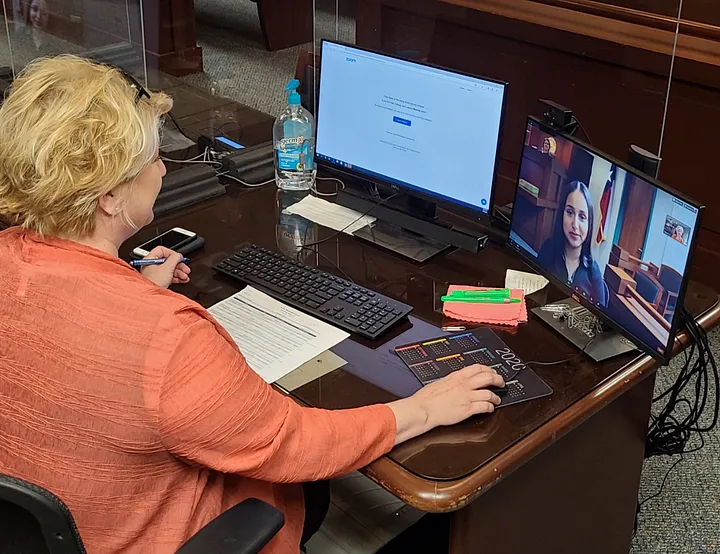
A member of Irving Municipal Court’s staff makes a reminder call. Image courtesy of the City of Irving.

“With those changes, we reduced the FTA rate down to 21.4 percent in 2019.”

Irving Municipal Court Director Wayne Lambert

But that was just the beginning of a dramatic drop in Irving’s FTA rate that continued through the COVID-19 pandemic, supported by the City’s culture of data-driven innovation and governance.

An Iterative Testing Process Yields Big Results

Irving’s shift to virtual court operations and hearings in the spring of 2020 did not slow down the court team’s FTA reduction efforts — to the contrary. Lambert and colleagues tested and optimized new and more customized call reminder approaches, while reallocating clerical staff to make calls and trying new tactics to prevent the need for some court hearings altogether.

“Amidst the crisis, we were determined to embrace new ways of thinking and operating that could sustain FTA rate progress and meet residents where they were at, literally. The ability to design evidence-based approaches was crucial.”

Irving Municipal Court Director Wayne Lambert
Irving Municipal Court staff in virtual-mode. Image courtesy of the City of Irving.

Early on in the pandemic, the court team began working with The Behavioral Insights Team (BIT), a What Works Cities expert partner, to create more impactful hearing reminder call scripts. With support and guidance from BIT, staff edited scripts to keep messages brief and to the point. One change: beginning scripts with, “This is a friendly reminder from the court,” so recipients would be more receptive to the information.

“BIT helped us take a very granular look at our language,” says Major Youngblood, a management analyst in the City Manager’s Office. “Its team walked us through the science behind starting friendly, then giving residents options, and then noting the consequence of missing a court date to make clear the City has enforcement powers.”

Landing on final reminder scripts was a data-driven process involving control and experimental groups, and four rounds of editing. The team targeted approaches for different reminder scenarios — customizing calls to individuals who received additional tickets and citations after previous court appearances — for example. Then the team tracked data to learn if certain messages prompted residents to appear for scheduled court dates more than other messages. It also tried an entirely new approach to obviate the need for residents to ever appear at a hearing. Court staff began working with prosecutors to prepare and make plea offers over the phone ahead of a hearing. If a resident accepted the terms, a scheduled hearing could be canceled.

This, along with data-driven evaluations of call reminder messages, reallocation of staff to deliver messages, and the convenience of virtual hearings, pushed Irving’s FTA rate down to less than 1 percent by early 2021, 0.42 percent, to be exact. Since voluntary virtual hearings played a major role in the FTA reduction during the pandemic, the court anticipates an FTA rate increase as Texas courts return to in-person hearings. That said, the court will continue offering virtual hearings and staff believes it will help maintain a low FTA rate.

A New Resident-Centric Data-Driven Normal

The rate reduction is an impressive feat — but Irving’s achievements relative to data-driven governance and innovation extend beyond the court. In the last three years, Irving has ramped up efforts to engage residents through open data practice approaches, creating a Data Governance Committee and an open data policy and portal.

“Through these resources, and by normalizing data analytics across city departments, we’ve been able to really hone our innovation priorities while also bringing residents into the problem-solving process.”

Irving Chief Innovation & Performance Officer Aimee Kaslik
Irving’s Data Governance Committee meets. Image courtesy of the City of Irving.

Last year, for example, the City launched Irving 360 2.0, an eight-week program that engages alumni of Irving’s 360 Civic Academy. Participants used both existing data and data gathered through resident focus groups to answer the question, “How does the City engage those who have historically not been engaged?” The group then presented its solution, a resident ambassador program, to the City Council.

Going forward, Irving plans to apply what it learned about court operations during the pandemic to ensure the new normal that emerges is mindful of residents’ varying needs and challenges. “Traditionally, obstacles such as transportation or child care would have prevented someone from coming into the court,” says Jennifer Bozorgnia, court services coordinator for the City.

“As Athens Clarke County Unified Government’s data capacity and culture continues to take root, the fruit of these investments will become more and more visible,” Manager Williams says. “In an era of increasing political polarization, when many conversations between residents and elected officials can come from an emotional place, basing decisions on reliable, trustworthy data lays a foundation for trust.”

“We are fighting to restore trust between the public and local government,”.

In crucial ways, the pandemic jumpstarted the City’s willingness to test new data-informed ways of operating. That jumpstart was supported by core data practices Irving staff had worked to strengthen and normalize in the preceding years — everything from stakeholder engagement to data governance to open data.

“We’ve seen what’s possible when data plays a central role in how we operate and deliver services to residents.”

Irving Chief Innovation & Performance Officer Aimee Kaslik

Today, going back to the old ways of working is not an option. “The results are clear, in the court and beyond,” says Kaslik. “We’re all excited to see what comes next.”

“Our new normal involves reaching people where they are, so to speak, by giving the option of virtual or in-person hearings.”

Irving Court Services Coordinator Jennifer Bozorgnia

Join Our Certified Cities!

Austin, Texas, USA

A Data-Driven Mindset Helps Austin Reimagine Public Safety.

Project Type:
Community Engagement, Equity, Finance, High-Performing Government, Public Safety

WWC - Gold Certification Badge for year 2021

At a Glance


The City’s five-year plan includes data-driven performance management to track how Austin accomplishes their goals such as safety, budget resources, and community services.


Formed a Reimagining Public Safety Task Force to offer recommendations to improve the Austin Police Department and public safety services.


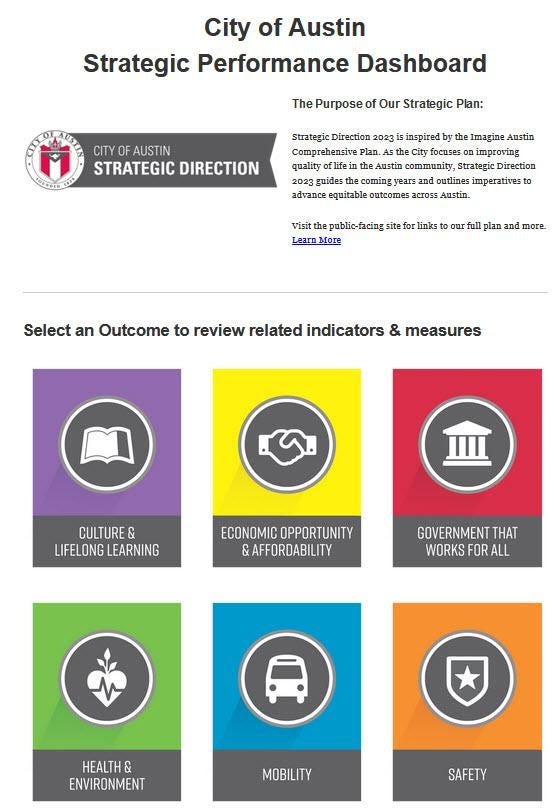
Austin’s strategic performance dashboard allows the public to keep tabs on progress toward all six of SD23’s strategic outcomes: economic opportunity and affordability; mobility, safety, health and environment; culture and lifelong learning; and government that works for all.

Reimagining Public Safety

In May 2020, residents of Austin, Texas took to the streets to protest the deaths of George Floyd, a Black man from Minneapolis, and Michael Ramos, a Black and Latinx man from Austin, at the hands of police officers.

Soon after, the City took action to rethink public safety and increase racial equity. In June, the City Council passed a resolution to achieve major new benchmarks: zero racial disparities in traffic stops, zero racial disparities in citations and arrests from traffic stops, and zero deaths at the hands of Austin police officers.

The same month, the City formed a Reimagining Public Safety Task Force made up of both city government and community group members. Its charge: offer recommendations to City Council for policy, budget, and structural changes to be made to the Austin Police Department (APD) and public safety services.

Data to Guide Public Safety Outcomes

The City wasn’t starting from scratch, however. The underpinnings of Austin’s public safety overhaul are driven by Strategic Direction 2023 (SD23), a five-year plan adopted by City Council in 2018 that has infused data-driven performance management into how Austin achieves ambitious goals. One of the plan’s targeted strategic outcomes is safety, and a key performance indicator (KPI) supporting that goal is “fair administration of justice.” Data gathering and analysis has guided the City’s work in this area, laying the groundwork for reform decisions.

For example, Austin’s Office of Police Oversight, Office of Innovation, and Equity Office jointly analyzed APD’s racial profiling data. Their joint report will serve as a baseline for future annual analyses. It found that in 2019, Black people made up 14 percent of all motor vehicle stops, 25 percent of all stops resulting in searches, and 25 percent of all stops resulting in arrests, though they comprise just 8 percent of the City’s population. The City has also analyzed 911 call data, finding that 41 percent of police officer time is spent on “Priority 3” calls — meaning that life or property is not at risk — and that 10 percent of all calls were related to mental health in some way.

The data raised some basic questions for the task force. “What do we want law enforcement to do, and what do we not want them to do?” says Farah Muscadin, director of the Office of Police Oversight and a member of the task force. “And how can we align ‘protecting and serving’ with what they’re actually trained to do?” Solutions needed to be informed by data — including qualitative data gathered from “community members disproportionately impacted by law enforcement,” she says. “We wanted them to help us come up with solutions so that everybody feels safe.”

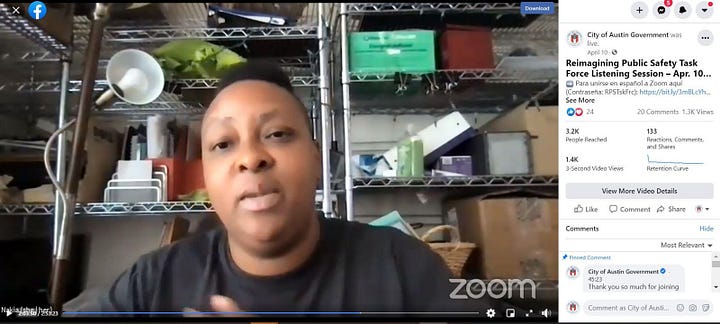
A resident participates in a public listening session held as part of the City’s Reimagining Public Safety initiative. Image courtesy of the City of Austin.

To engage community stakeholders and gather qualitative data that would inform the task force’s work, each of Austin’s 10 Council Districts held a public listening session. There were also three citywide sessions, including one held in Spanish. The events included scenario-based conversations with residents about how they thought the City should handle certain public safety situations. To ensure the voices of those disproportionately impacted by inequities in public safety services were heard, a diverse range of community organizations and neighborhood associations hosted more than two dozen sessions in addition to the city-hosted events.

A total of nearly 1,000 people participated across a range of ZIP codes, races and ethnic groups, and the takeaway was clear. “In most of the scenarios, the majority of folks said that they didn’t want a police response,” says Brion Oaks, the city’s first-ever Chief Equity Officer, who co-chairs the task force. “But the reality is that today, it’s the only response we offer.”

In April 2021, the task force issued its recommendations report, focusing on various ways the City Council could reallocate funds away from APD to bolster the safety and wellbeing of communities of color. Recommendations included defunding the mounted patrol and K-9 units of the APD, and creating a center to respond to mental health calls separate from the 911 police dispatch system. The report offers a data-informed reimagining of the City’s public safety budget, building on City Council’s decision last year to redirect $153 million of APD’s budget.

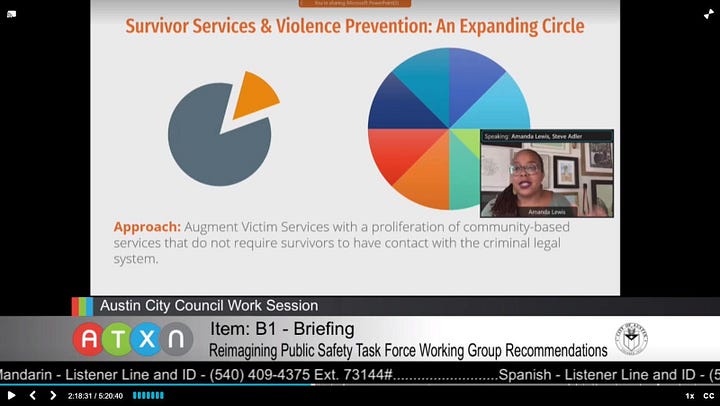
The task force presented its recommendations to Austin City Council in April. Image courtesy of the City of Austin.

Since then, the Governor of Texas signed HB 1900. The legislation creates severe financial penalties for any city that meets the definition of a “defunding municipality.” Austin’s proposed Fiscal Year 2022 budget fully complies with the new law, but the City remains committed to advancing progress on reimagining public safety initiatives.

“Let’s think big. What if we really wanted to make our city safer? Are we willing to engage in the re-imagining of policing if it could make us safer?”

Austin Mayor Steve Adler

Becoming a Data-Driven Organization

The City’s work to address racial inequities and increase police accountability can’t be separated from the data-driven performance framework established through SD23, says Kimberly Olivares, Austin’s deputy chief financial officer and former chief performance officer. The public safety work is just one dimension of the framework, which the entire city government is now geared toward.

“Our city manager has restructured his leadership team and the budget process around the strategic outcomes within the plan. It’s become part of our everyday life and how we talk about what we do and how we serve the community.”

Austin Deputy Chief Financial Officer & Former Chief Performance Officer Kimberly Olivares

The City maintains a strategic performance dashboard, allowing the public to keep tabs on progress toward all six of SD23’s strategic outcomes: economic opportunity and affordability; mobility; safety; health and environment; culture and lifelong learning; and government that works for all. The dashboard breaks each goal down into different indicator categories and metrics measuring progress, each given a clear status: “on track,” “off track,” “near target” or “measuring.” The City, in other words, is holding itself publicly accountable for SD23’s goals. (The dashboard is just one component of Austin’s larger open data portal.)

Screenshot of Austin’s strategic performance dashboard. Image courtesy of the City of Austin.

Having clear, shared priorities and KPIs to rally around was a crucial first step in the City’s performance management journey — and there was a strong desire across city departments for SD23’s structured approach, says Spencer Cronk, Austin’s city manager. The next step: establishing data-driven governance practices that enable change to be defined and tracked.

“You have to measure and make visible what you want to change and how you want to change,” Cronk says. “Defining success through specific data indicators has helped us stay focused — and that’s helping us achieve real outcomes for our residents.”

Join Our Certified Cities!

Arlington, Texas, USA

In Arlington, a Can-Do City Connects and Communicates with Data.

Project Type:
Community Engagement, Communications, Cross Sector Collaboration, Finance, High-Performing Government, Infrastructure, Transportation

2019 Silver Certification & 2020 Gold Certification

At a Glance


Partnered with researchers, developers, students and entrepreneurs to explore real-world applications of city data that could solve community issues, provide targeted services or spur investments.


Open Arlington Portal allows residents to explore data through interactive maps to better understand their community, encouraging data transparency and public engagement.


Used data to identify and secure federal funding for an innovative solution for their residents and visitors public transit needs through a partnership with rideshare company Via.

Helping Residents Understand their H2O Intake

Last year’s dry summer in Arlington, Texas came as the City reached the halfway point in a 10-year project to install remotely read water meters throughout the community. Soon a controversy emerged, largely driven by posts on social media: Some households had been receiving higher water bills, and residents wanted to know if it was a result of the new technology.

The short answer was no, but officials knew that overcoming such speculation would demand a longer explanation. The City immediately set about to pull historical data showing that increased water use and, thus, higher bills were in alignment with seasonal fluctuations during warmer months. The City also ensured residents had a greater understanding of how their bills are determined, including that the cost of water per 1,000 gallons rises as residents reach higher levels of consumption.

Image Courtesy of the City of Arlington.

But Arlington didn’t stop with an explanation — it also looked to empower residents with information. The City launched the Know Your H20 website so that residents can view their billing history over the past two years, compare usage across temperature changes, and monitor their consumption on a daily basis. The City also released new data on its open data portal, allowing residents to see water usage by zip code and filter by the type of meter the information came from. And they got the word out about these new tools via a Know Your H20 communications campaign.

Making Data Relatable

Look across nearly any of Arlington’s efforts, and you’ll notice a similar trend: Fostering transparency and building an effective local government only scratch the surface of the City’s goals for using data and evidence. Beneath that is a desire for helping residents find and use publicly available information to ask questions, understand, and engage. Arlington’s open data progress goes beyond both policy and portal to people, and the key to making that leap has been the City’s extensive communications efforts.

Director of Communication and Legislative Affairs Jay Warren doesn’t mince words when he says, “Just to be blunt, data can be boring.” But he and his team are undaunted as they turn to stories, graphics, and other digestible and engaging forms of content to make data interesting. Moreover, communications isn’t an afterthought in the City’s data-driven strategy; Communication Coordinator Susan Schrock sits on the City’s data governance committee, for example, and this integrated approach has great support from city leadership.

“When we talk about innovation and open data, a lot of people think this is rocket science, but it’s really not — it’s really basic. So if we can take the data that comes out of complex systems, simplify the messaging, then relate it on a human level to our residents, to me that’s what it’s all about.”

City Manager Trey Yelverton

Breaking Down the City Budget

One thing practically every resident relates to is how their tax dollars are being spent. As a well-managed city, Arlington makes budget allocations based on data, which is fundamental for building the community’s confidence in City Hall.

The City’s budget portal allows residents to drill down into investments, and Arlington bolsters its transparency with efforts to help residents fully understand the City’s finances, such as the recent Budget in Action campaign. The campaign included assets such as a video inviting residents to get to know the 2019 operating budget and a Taxpayer Investment Value Guide that made the budget’s large dollar amounts relatable by comparing them to the average household’s expenses. By the end of the campaign, a quarter of the population had engaged with budget content in some way. And Arlington is continuing to provide regular updates on the five City Council priority areas outlined in the budget through newsletters, videos, social media, and more.

Public Transit Takes a Fresh Turn

Data analysis has also helped the City make informed decisions about when to stop funding initiatives. Until six years ago, when Arlington launched its single-route MAX bus, the city was the largest in the country without a public transportation system. Officials anticipated that the bus would be used for around 600 rides each day, but actual numbers only reached around half that. As it turned out, because Arlington’s 400,000 residents are spread out across the city’s nearly 100 square miles, the community lacked the density necessary along the bus’s corridor to drive ridership to a level that would offset the investment. The bus service was discontinued, but the need for public transportation remained.

Image Courtesy of the City of Arlington.

Identifying a creative way to meet that need, the City partnered with Via, an on-demand rideshare company. Residents can use the Via app to instantly book a seat in shared vehicles with flexible routes that currently cover about one third of the city and are due to expand. (For residents without smartphones or who don’t wish to use a credit card, the service has alternate scheduling and payment options.) In one recent week, residents took more than 4,500 rides using the service. Because of the City’s ability to provide data collected with Via, Arlington is one of the only cities in the country receiving Federal Transportation Administration grant funding to support its Via public transit alternative.

Residents Using Data

Finding this innovative, data-driven solution is just one demonstration of why city officials call Arlington “a can-do city.” And residents are following their lead. They’re using their Amazon Alexa-enabled devices to ask questions, such as where to find their voting location, that are answered via open data. A group of teens participating in an Arlington Public Library coding program recently borrowed an idea from Code for Anchorage, creating an online game, based on city data, that lets players guess the most popular dog names in town. And Matthew Taylor, a local developer, has used city data to create a site that allows residents to quickly determine their trash day.

“I’m 100 percent in favor of every city doing this. It could change how people live. If someone can find that one application that really does improve someone’s life, that can make a difference. And Arlington is supporting that.”

Open Data Technician Matthew Taylor

Join Our Certified Cities!

Disclaimer