Cambridge, Massachusetts, USA
Innovation Developed from a Culture of Goal-Setting in Cambridge.
Project Type:
Community Engagement, Communication, Economic Development, Environmental, Equity, Health & Wellness, High-Performing Government, Infrastructure, Public Safety

This narrative was written for Cambridge’s 2021 Gold What Works Cities Certification. The City also achieved Gold Certification in 2023 and 2024 — one of only two cities to achieve Gold three times. Some content in this narrative may be outdated. For the most current information, please visit www.cambridgema.gov.
At a Glance
The Safety Net Collaborative Program and its social harm index sought to use data to prevent harm and crime through a safety net working with the police, schools, and human services.
The Community Development Department launched its Small Business Data Dashboard to connect people to vital information such as demographics, average industry wages, and regulatory requirements – helping residents create and grow small businesses and explore ways to increase their opportunities.
Developed a data-based predictive model that empowered the city to tackle its recycling contamination problem and target outreach to properties more prone to recycling violations, all of which cut the contamination rate to under 6 percent.
Public Safety in Cambridge
The glowing lights on the Robert W. Healy Public Safety Facility in Cambridge, Massachusetts make the entire building appear to breathe. At night, when the Emergency Communications and 911 Center receives a call, they’re impossible to miss. The LED lights along the building’s brick exterior signal activity in the emergency dispatch system. When the system is quiet, blue lights slowly fade in and out. They flicker in blue, red, or green when a dispatcher inside connects a caller to the police department, the fire department or emergency medical services. It’s a public art installation that lends transparency to essential services — and a visible reminder that the City of Cambridge is always at work responding to residents’ needs.
Home to world-renowned universities and scores of startups, Cambridge has a reputation for turning good ideas into reality. Kendall Square, the neighborhood that abuts the Massachusetts Institute of Technology and contains the public safety facility, has been called “the most innovative square mile on the planet.” City officials aren’t stuck in their ways and don’t get defensive when problems surface. Instead, they dive into data and proactively devise solutions that bolster services.
“I always push staff to look at different options, discuss alternative solutions, or engage in more dialogue with the community so that we can come up with the best possible solutions.”
With a population of 118,000 spread across just six square miles, Cambridge may be relatively small compared to Boston and other certified cities. But it punches way above its weight when it comes to fostering a transparent data-driven culture that delivers for residents. Within and across departments, innovation flows out of a culture of goal-setting.
“Building staff capacity and skills to use data, evidence, and stakeholder engagement is critical to our city’s ability to make more informed decisions, deliver more effective services and programs, and improve our residents’ lives.”
Evolving the Policing Model
Violent crime rates have dropped drastically in Cambridge in recent decades, in line with many other U.S. cities. Currently “only three percent of our calls for service are serious crimes,” Deputy Superintendent Daniel Wagner says. “97 percent of what we’re being called to respond to now are complex social issues.”
These issues include substance abuse, domestic violence, homelessness, and juvenile delinquency. They cannot be solved by police officers alone — so the Cambridge Police Department has evolved to act as a bridge between individuals in need of help (especially repeat offenders) and various city departments offering wraparound services. “Policing in Cambridge is not just about arrests,” Wagner says. “It’s about getting people the help that they need.”
Through the city’s juvenile-focused Safety Net Collaborative Program, individuals from the police, health, schools, and human service departments meet bi-weekly to implement a case management approach. Breaking down silos in government, city staff work together to identify services that can help individuals avoid problem behavior that leads to arrests. Research has demonstrated that Safety Net has had a significant impact on juvenile arrests (according to a 2016 study, community arrests have decreased more than 50 percent since its implementation), recidivism, and service utilization (contracting with mental health services has led to an average of 94 outpatient mental health provider referrals per year).
Evidence-based decision-making guides all of this work. With the Cambridge Police Department’s Focused Deterrence Program, officials developed a “social harm index” to identify chronic offenders and the most-effective strategies for use of wraparound services. A mathematical model is used to evaluate the seriousness, frequency, and recency of harmful behavior to identify this small group of serious and prolific offenders. They then are partnered with social service agencies, community leaders, and other criminal justice agencies to implement an evidence-based crime-prevention program to directly engage with offenders in an effort to disrupt their harmful behavior before they re-offend.
This is what the future of policing looks like, Wagner says — “proactive strategies to try and prevent harm and crime through a safety net working with substance abusers and homeless outreach and social workers.”
Data lives at the core of the police department’s work in other ways as well. The department is working to improve how it measures whether racial profiling is occurring within the police force. Police Commissioner Branville G. Bard Jr., who completed a Ph.D. dissertation about racial profiling, is moving the city away from population benchmarking to focus on the reason, duration, and severity of police stops.
With population benchmarking, Bard notes, governments look to see if a police force stops an appropriate percentage of people relative to the demographic profile of the city. But that approach doesn’t offer a full picture of a person of color’s experience with the police force. How long were they held? Were they given a more severe ticket or response than what a white person in the community stopped for the same offense receives? Cambridge’s new system is overseen by the police department’s Office of Procedural Justice, which is focused on monitoring data about police-resident interactions.
The new approach weighs the actions of individual officers against the actions the police department feels an officer could have reasonably taken in any given situation. It collects data at the individual officer level and is expected to be sharing aggregate data with the public by the end of 2020 with a sample dashboard available for the public.
Mission Control for Small Businesses
The Community Development Department (CDD) is also using data to improve the city’s quality of life — but in a very different way. It’s helping local businesses thrive.
Christina DiLisio, the CDD’s associate economic development specialist, wanted to create a tool that could help current and aspiring business owners access market research and understand the city’s business climate. In 2018, her department launched its free Small Business Data Dashboard to connect people to vital information such as customer base demographics, average industry wages, and regulatory requirements. The dashboard pulls information from the city’s open data, the Bureau of Labor Statistics, the U.S. Census Bureau, and other sources to provide information on available local commercial properties, license and permitting information, and other business resources available from the city.
Robin Brown is a business owner in the Cambridge Food Truck Program. He owns and operates the Pull Up food truck which offers soul food and Latin cuisine. Brown has gone on to grow his business and has often checked in with the City of Cambridge to explore increasing vending opportunities. He’s been connected to the Small Business Data Dashboard with real estate options for potential brick and mortar locations.
“[The dashboard] lets people ask questions about their industry and have a productive conversation about potential pitfalls when starting a business.”
“‘Do you know how to think about competitors? Do you know how much your goods cost?’ We can’t give people business advice, but we can give them valuable data,” DiLisio says.

Nudges in the Right Direction
Cambridge’s commitment to setting goals and doggedly pursuing them is hard to miss in the realm of recycling. Back in 2009, the city committed to reducing trash across the city by 30 percent by 2020 (using 2008 as baseline). Its strategy partly focused on improving residential recycling practices.
Because of its data tracking practices, the city’s Department of Public Works (DPW) knew Cambridge had a recycling contamination problem that was bad for the environment and its budget. When a load of recyclables is contaminated with things like plastic bags and clothing, it cannot be sold as easily–so waste management companies mark up their collection fees. Cambridge’s waste company sets its recycling contamination threshold at 7 percent; anything higher and the city has to pay more.
In 2018, when the average contamination rate was 11 percent, Cambridge set a new performance goal of reducing contamination to below 7 percent by the end of 2019. “Everyone in our division is really passionate about recycling and passionate about the environment,” Michael Orr, the Director of Recycling at DPW, says. “We decided we had to do this.”
If the city could train more residents to recycle properly, it would lead to more recyclable material being accepted, thereby reducing the city’s trash production and lowering hauling costs. The DPW took a data-driven approach, diving deep into contaminants so it could target its education efforts. It surveyed more than 1,000 recycling carts citywide and determined which items were most frequently the source of the contamination.
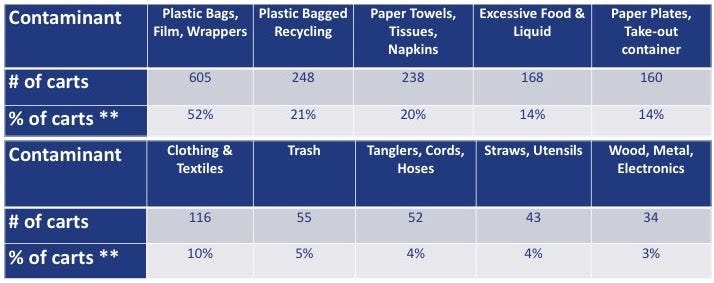
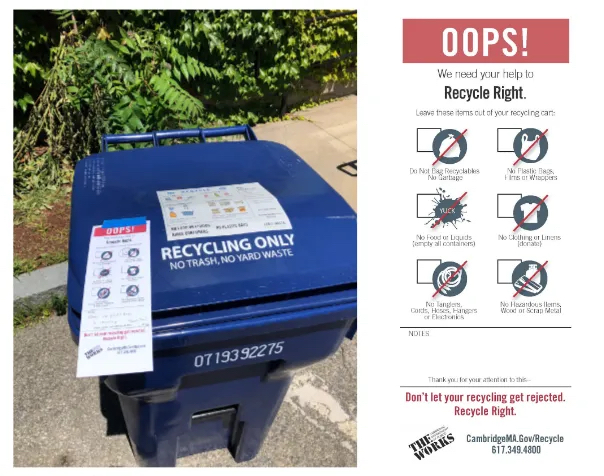
By individually counting the contaminants in each cart, DPW staff learned where residents needed the most help. It then began new communication practices — one involved “OOPS!” tags to nudge residents toward better recycling habits.
But DPW’s strategy for achieving its trash reduction goal didn’t only rely on changing resident behavior. With the assistance of What Works Cities partner, the Center for Government Excellence at Johns Hopkins University (GovEx), Cambridge developed a predictive model that allows the city to target outreach to properties more prone to recycling violations. The city also added financial incentives into its contracts with curbside pickup vendors. Now drivers can receive bonuses from the city for delivering recycling bins to collection facilities with little or no contamination, as measured by rejection rates. It’s a win-win-win: the city saves money on its overall waste bill, more material is recycled and drivers benefit as well.
By the end of 2019, the strategy had cut the contamination rate to under 6 percent. Cambridge met its 30 percent trash reduction goal in early 2019, one year early. However, the team isn’t planning on resting on their laurels. They are now aiming to reduce trash even further, to an 80 percent reduction of 2008 levels of waste by 2050.
“I’m incredibly proud of this achievement and the innovative waste reduction programs deployed by city staff,” DePasquale says. “Equally important, it highlights the close collaboration we have with the city’s passionate residents. Public buy-in and resident engagement are critical to accomplishing any citywide goal.”
Read more about Cambridge’s data journey here.
“This accomplishment highlights the deep commitment city departments have to data-driven decision-making.”