Boulder, Colorado, USA
Project Type:
Communications, Cross-Sector Collaboration, Environment, Equity, Health & Environment, High-Performing Government, Infrastructure, Public Safety

2024 Gold Certification
Boulder, Colorado, is preventing eviction. Boulder’s Eviction Prevention and Rental Assistance Services program helps residents resolve eviction-related housing issues through legal services, rental assistance and mediation. In 2024 the City evaluated eviction outcomes when city services were provided compared to when no services were provided. Through tracking this data, the City found that services provided led to a 96% eviction prevention rate for active participants, compared to a 58% eviction prevention rate for non-participants. In 2024, guided by their evaluation and community feedback that housing stability was a top issue, the City allocated an additional $253,000 for the program for FY25.
2020 Silver Certification
Data helped the city maintain its goal to reduce its organizational emissions and will continue to encourage the city to optimize machine-learning models that will save costs and minimize environmental impacts.
Created a live dashboard using 911 call data that helps firefighters use real-time insight into emergency trends and improves service delivery.
Boulder partnered with local artists to stage a data-driven art exhibit to increase community awareness of Boulder’s open data work. They turned data files into colorful art installations that helped residents visualize data in a unique way and drove interest in the city’s data transparency efforts.
Incorporated new data practices during COVID-19 to evaluate efforts in reducing racial inequities, reviewing demographic data in infection and hospitalization rates, employment, basic needs assistance programs, evictions, and foreclosures.
Bringing Fun Into Environmental Justice
Every summer, hundreds of people gather on the banks of Boulder Creek to commute to work in unconventional fashion: by inner tube. The annual “Tube to Work Day” is a challenge to the community to leave cars behind and lower greenhouse gas emissions — and an invitation to have fun. Some participants dress in full business attire as they ride the leisurely stream into downtown Boulder, Colorado.
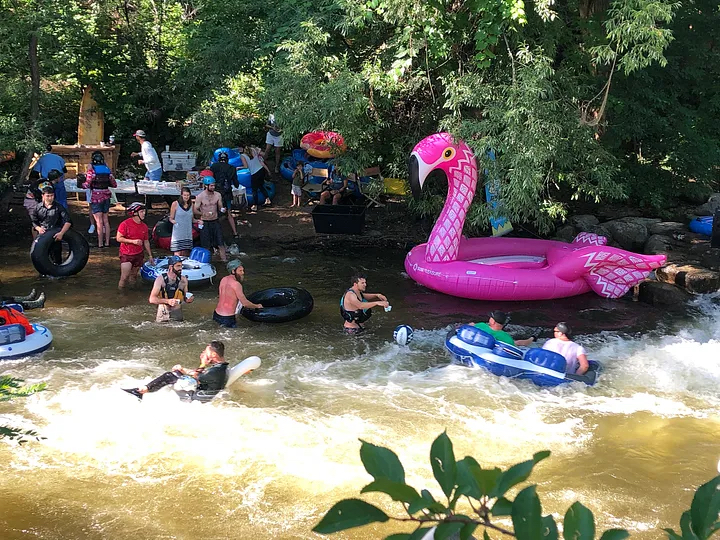
The city takes pride in the event, which is quintessential Boulder: quirky and environmentally conscious. Located at the edge of the Rocky Mountains and home to the University of Colorado Boulder, the city has emerged as a green tech startup powerhouse.
People aren’t afraid to boldly tackle big challenges through innovation — something easy to see in Boulder’s climate initiatives. The city government’s goal is to reduce its emissions 80 percent below 2008 levels by 2030. As of now, it’s achieved a 38 percent reduction and is proud to lead the way in making its buildings more efficient and powering its services with local solar generation.
Building a Culture of Innovation by Failing Fast
Boulder’s spirit of goal-setting and data-driven performance management infuses far more than its work around climate, though. The city created the chief innovation and analytics officer role in 2016 and hired Julia Richman to spearhead a culture of data-driven innovation across the government. Julia and her Innovation and Technology team pushed city departments to pilot new data-based approaches without fear of failure.
“Their team’s work established the core principles of data and innovation work in the city, and we continue to push those boundaries today,” said Jennifer Douglas, the city’s current chief innovation and technology officer. “The ‘fail fast’ culture that is prevalent in many innovation-driven industries is working its way into government decision-making. By anticipating where problems might occur and allowing an iterative process, we can minimize risks, reduce costs, and ensure that the services we’re providing are aligned with our community’s needs.”
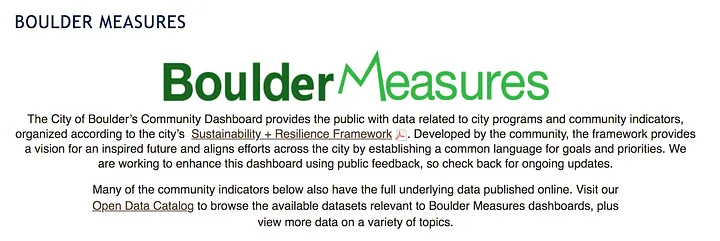
Transparency has been a big part of culture change. Silos have been broken down: Today, 90 percent of the city’s departments have publicly available open data sets and collaborate on data-driven performance management. With the assistance of What Works Cities partner the Center for Government Excellence at Johns Hopkins University (GovEx), the city created Boulder Measures — a community dashboard that connects the community to relevant data. Using data to inform decisions about what’s working and what can be improved is Boulder’s modus operandi.
Treating Water with AI
Recent innovations at the city’s wastewater treatment facility are a great example of how the use of data spans departments. Currently, over 12 million gallons of water come through Boulder’s sewer system every day, where it passes through the Boulder Water Resource Recovery Facility (WRRF) before entering Boulder Creek.
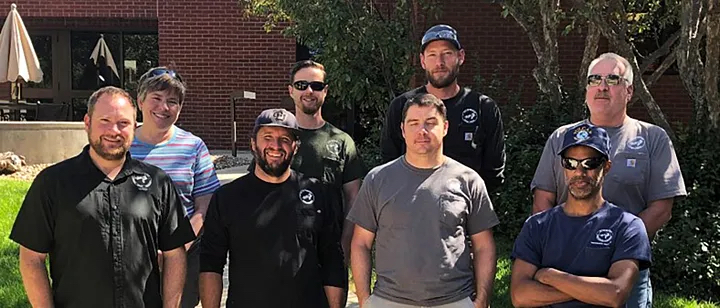
Ensuring treated water meets environmental and public health standards is a vital and complex process. Two WRRF employees — Wastewater Treatment Manager Chris Douville and Treatment Process Engineer Christopher Marks — were determined to make it more energy-efficient.
Typical water treatment facilities run a microbiological system using dissolved oxygen control of aeration to clean water. The WRRF team, working with the Colorado School of Mines and Carollo Engineers, Inc., tested an ammonia-based aeration control strategy that has become more common in recent years. They optimized its performance, then worked to improve upon its reaction time by forecasting the ammonia concentration. But first they needed an immense amount of data. To track things like water temperature, flow rates, nutrients and oxygen levels, they utilized measurement probes already installed for monitoring along every step of the treatment process. After crunching the numbers, the team created a hybrid statistical machine learning model that could predict ammonia concentrations 50 minutes in advance.
The team hopes this forecasting approach — which is 90 percent accurate — will cut down on the amount of energy used in the future and minimize financial and environmental impacts. The team’s efforts have already reduced energy consumption at the facility and saved an estimated 500,000kWh valued around $15,000.
This work with the city by Colorado School of Mines and Carollo Engineers, Inc. is shining in many areas. It earned first place in the 2019 Intelligent Water Systems Challenge and was published in the Journal of Water Process Engineering in 2020 to share the method with other utilities that may benefit from the work.
Creating this innovative model didn’t happen overnight though. It required a willingness to experiment and multiple iterations over two years that included failures and setbacks to reach this kind of success. “It’s alright though,” said Marks. “This is the Boulder way — we took 10 well thought out steps, rather than one giant leap, and always worked together collaboratively with the whole WRRF team.”
“This is the Boulder way — we took 10 well thought out steps, rather than one giant leap, and always worked together collaboratively with the whole WRRF team.”
Fighting Fires with Data
The city’s culture of a data-first approach can also be seen across town in the fire department. With Boulder nestled against the Flatirons and Boulder Creek running through downtown, the city is prone to flooding. As a result, one of the city’s fire stations was located on a 100-year floodplain and officials knew it had to be relocated. But where exactly? A data analysis of previous call data helped the fire department determine the station’s new home.
Department staff worked with Emergency Medical Services (EMS) to review three years-worth of emergency calls and identify where firefighting and emergency services could be most effectively repositioned. The goals were to boost service delivery to a part of the city lacking an industry-standard four-minute response time, while decreasing call volume to the other stations. Construction of the new station should be complete in 2020 and the city hopes the station will also double as a community meeting space.

Image Courtesy of the City of Boulder.
But the department’s smart data practices go much deeper than this standalone project. The fire department’s new data dashboard gives firefighters valuable real-time insights into fire trends around the city, supporting better prevention strategies and improved service delivery.
In October 2019, before the dashboard was created, there were hundreds of Fire Incident Reports outstanding — meaning data from these reports hadn’t been entered into the department’s database. Without more timely data from those reports the department was missing opportunities to see important patterns in the locations of fires or types of calls for service being received.

Now, with data entry streamlined and the new dashboard live, the number of outstanding reports is down to 30. Insights can be gleaned, and lives and property can be better protected across the city.
“This dashboard really helps us go a step further and create a culture of performance measurement,” said Wendy Korotkin, project manager for data and analytics for the Boulder Fire Department.
“When we are problem-solving based on data specific to us, we’re able to more effectively respond to our community’s needs and ensure the highest standard of public safety.”
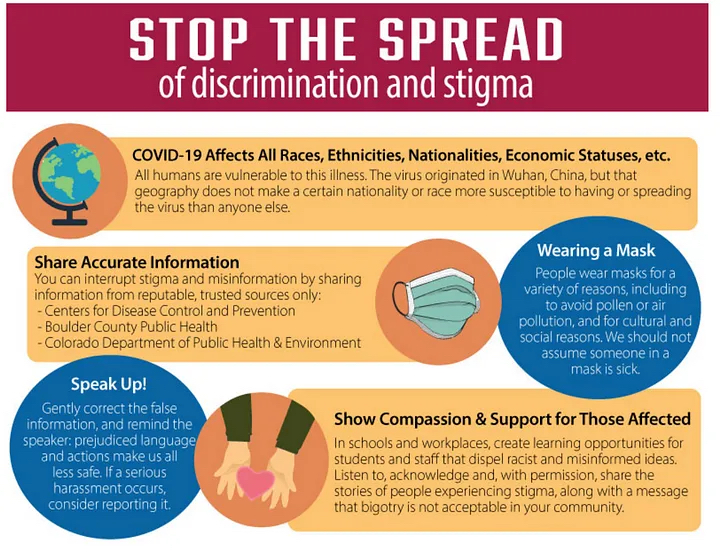
Boulder’s COVID-19 Response
Racial disparities in the impacts of COVID-19 have affected communities across the United States, but in Boulder, the city is ensuring that data drives its response. Based on city and Boulder County data, Hispanic and Latinx community members are experiencing COVID-19 infections and hospitalizations at a higher rate than the white population. Latinx, Black, and Asian community members experienced COVID-19 related job loss at a rate higher than white community members. As with other health and economic disparities, the causes of these disparities are likely to be embedded in systemic bias and disenfranchisement.
“Our work is rooted in closing these gaps, so that race does not predict one’s ability to thrive,” said Aimee Kane, the city’s equity program manager. “To lift up people of color and support those who are unjustly burdened, we need clear benchmarks to show our progress — or lack thereof — so that we can effectively do this work.”
As part of the city’s COVID-19 response and recovery planning, staff worked to determine which data could and should be collected to measure whether our activities successfully reduced racial inequities. The following data sets could help Boulder and other cities gauge the rate of recovery from the pandemic, by demographic:
- COVID-19 infections and hospitalizations
- Job loss, employment and type of employment
- Basic needs assistance program requests and enrollments
- Type of business re-opened
- Evictions and foreclosures
- Types of 911 calls and other crisis interventions
The city is working with local, state and federal partners to respond, while its ongoing equity and engagement efforts prioritize working directly with those most negatively impacted to ensure city efforts align with community needs.
For example, informed in part by engagement methods tested during the city’s 2018 Bloomberg Philanthropies Mayors Challenge project, the city created a team of Emergency Response Connectors to help distribute information across the diverse cultures in Boulder. These connectors are trusted voices within its neighborhoods who share COVID-19 information, educate about community resources, and document concerns raised by neighbors.
Engaging the Public Creatively
Boulder has made many areas of data public in recent years. The Innovation and Technology Department has been committed to an open data strategy that engages the public in the interest of transparency, accountability and empowerment. The city has now published over 110 data sets on its open data catalog, many of which are updated daily.
But after reviewing download rates early on, the team realized there was a lack of community awareness of Boulder’s open data work. To spark more interest, they decided to partner with local artists to stage an art exhibit inspired by city data. The 2018 exhibit, led by the city’s Open Data Manager, Nicolia Eldred-Skemp, turned CSV data files into colorful art installations, visualizing everything from prairie dog populations, to historic weather patterns, to how community members perceive their safety.
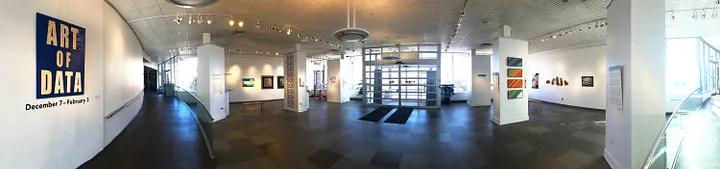
“People are used to seeing data in graphs and charts, and this exhibit was a really unique, wonderful way to share this information,” said Eldred-Skemp. “I think it helped bridge some gaps and drive interest from a wider audience, while also giving people a sense of community and involvement with the city.”
The project was a collaboration between the City of Boulder’s Innovation and Technology Department, the City Manager’s Office, and the Boulder Public Library, and the idea was inspired by Kansas City, Missouri’s successful Art of Data exhibit.

By the end of the exhibit, the public perception and awareness around Boulder’s open data work had gone up. There was a 113 percent increase in unique page views of the open data catalog during the three-month installation. The city also established stronger relationships with local community organizations like Code for Boulder and the University of Colorado at Boulder as a result of the exhibit collaborations — and hopes to build on this success with an even larger exhibit in the future.